Nepalese vs Yugoslavian Child Poverty Under the Age of 5
COMPARE
Nepalese
Yugoslavian
Child Poverty Under the Age of 5
Child Poverty Under the Age of 5 Comparison
Nepalese
Yugoslavians
18.3%
CHILD POVERTY UNDER THE AGE OF 5
8.7/ 100
METRIC RATING
212th/ 347
METRIC RANK
17.2%
CHILD POVERTY UNDER THE AGE OF 5
54.1/ 100
METRIC RATING
172nd/ 347
METRIC RANK
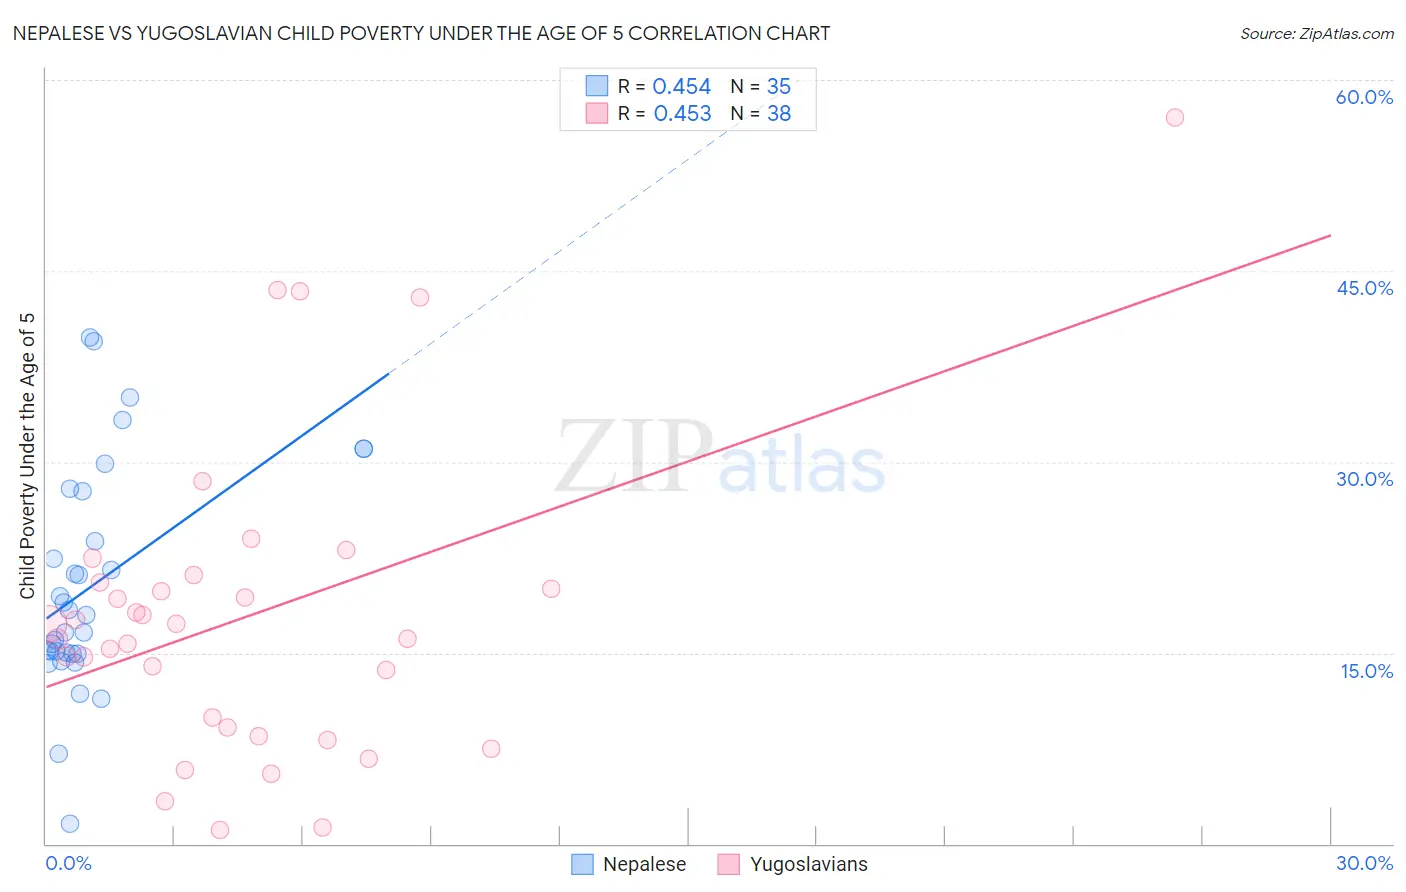
Nepalese vs Yugoslavian Child Poverty Under the Age of 5 Correlation Chart
The statistical analysis conducted on geographies consisting of 24,301,294 people shows a moderate positive correlation between the proportion of Nepalese and poverty level among children under the age of 5 in the United States with a correlation coefficient (R) of 0.454 and weighted average of 18.3%. Similarly, the statistical analysis conducted on geographies consisting of 276,797,042 people shows a moderate positive correlation between the proportion of Yugoslavians and poverty level among children under the age of 5 in the United States with a correlation coefficient (R) of 0.453 and weighted average of 17.2%, a difference of 6.6%.
Child Poverty Under the Age of 5 Correlation Summary
| Measurement | Nepalese | Yugoslavian |
| Minimum | 1.6% | 1.0% |
| Maximum | 39.8% | 57.0% |
| Range | 38.2% | 56.0% |
| Mean | 20.3% | 17.9% |
| Median | 18.0% | 16.7% |
| Interquartile 25% (IQ1) | 15.0% | 9.1% |
| Interquartile 75% (IQ3) | 27.7% | 20.5% |
| Interquartile Range (IQR) | 12.7% | 11.4% |
| Standard Deviation (Sample) | 8.8% | 12.1% |
| Standard Deviation (Population) | 8.7% | 11.9% |
Similar Demographics by Child Poverty Under the Age of 5
Demographics Similar to Nepalese by Child Poverty Under the Age of 5
In terms of child poverty under the age of 5, the demographic groups most similar to Nepalese are Immigrants from Thailand (18.3%, a difference of 0.020%), Moroccan (18.2%, a difference of 0.21%), Panamanian (18.2%, a difference of 0.30%), Spanish (18.2%, a difference of 0.31%), and Scotch-Irish (18.2%, a difference of 0.32%).
| Demographics | Rating | Rank | Child Poverty Under the Age of 5 |
| Spaniards | 12.8 /100 | #205 | Poor 18.1% |
| Whites/Caucasians | 12.6 /100 | #206 | Poor 18.1% |
| Immigrants | Immigrants | 9.9 /100 | #207 | Tragic 18.2% |
| Scotch-Irish | 9.8 /100 | #208 | Tragic 18.2% |
| Spanish | 9.8 /100 | #209 | Tragic 18.2% |
| Panamanians | 9.7 /100 | #210 | Tragic 18.2% |
| Moroccans | 9.4 /100 | #211 | Tragic 18.2% |
| Nepalese | 8.7 /100 | #212 | Tragic 18.3% |
| Immigrants | Thailand | 8.6 /100 | #213 | Tragic 18.3% |
| Malaysians | 6.5 /100 | #214 | Tragic 18.4% |
| Immigrants | Panama | 6.0 /100 | #215 | Tragic 18.5% |
| Hmong | 5.0 /100 | #216 | Tragic 18.5% |
| Immigrants | Africa | 4.6 /100 | #217 | Tragic 18.6% |
| Delaware | 3.4 /100 | #218 | Tragic 18.7% |
| German Russians | 3.0 /100 | #219 | Tragic 18.8% |
Demographics Similar to Yugoslavians by Child Poverty Under the Age of 5
In terms of child poverty under the age of 5, the demographic groups most similar to Yugoslavians are Welsh (17.2%, a difference of 0.010%), Immigrants from Saudi Arabia (17.2%, a difference of 0.43%), Immigrants from Morocco (17.1%, a difference of 0.51%), Immigrants from Western Asia (17.1%, a difference of 0.54%), and Immigrants from South America (17.1%, a difference of 0.63%).
| Demographics | Rating | Rank | Child Poverty Under the Age of 5 |
| Immigrants | Colombia | 66.9 /100 | #165 | Good 16.9% |
| Slavs | 64.0 /100 | #166 | Good 17.0% |
| Immigrants | Uzbekistan | 62.0 /100 | #167 | Good 17.0% |
| Uruguayans | 60.5 /100 | #168 | Good 17.0% |
| Immigrants | South America | 60.0 /100 | #169 | Good 17.1% |
| Immigrants | Western Asia | 59.2 /100 | #170 | Average 17.1% |
| Immigrants | Morocco | 58.9 /100 | #171 | Average 17.1% |
| Yugoslavians | 54.1 /100 | #172 | Average 17.2% |
| Welsh | 54.0 /100 | #173 | Average 17.2% |
| Immigrants | Saudi Arabia | 50.0 /100 | #174 | Average 17.2% |
| Immigrants | Lebanon | 47.6 /100 | #175 | Average 17.3% |
| Immigrants | Iraq | 45.2 /100 | #176 | Average 17.3% |
| Immigrants | Sierra Leone | 43.6 /100 | #177 | Average 17.3% |
| Immigrants | Cameroon | 42.7 /100 | #178 | Average 17.4% |
| Hawaiians | 41.5 /100 | #179 | Average 17.4% |