Immigrants from Argentina vs Luxembourger Child Poverty Among Girls Under 16
COMPARE
Immigrants from Argentina
Luxembourger
Child Poverty Among Girls Under 16
Child Poverty Among Girls Under 16 Comparison
Immigrants from Argentina
Luxembourgers
14.6%
CHILD POVERTY AMONG GIRLS UNDER 16
98.3/ 100
METRIC RATING
68th/ 347
METRIC RANK
14.3%
CHILD POVERTY AMONG GIRLS UNDER 16
99.0/ 100
METRIC RATING
53rd/ 347
METRIC RANK
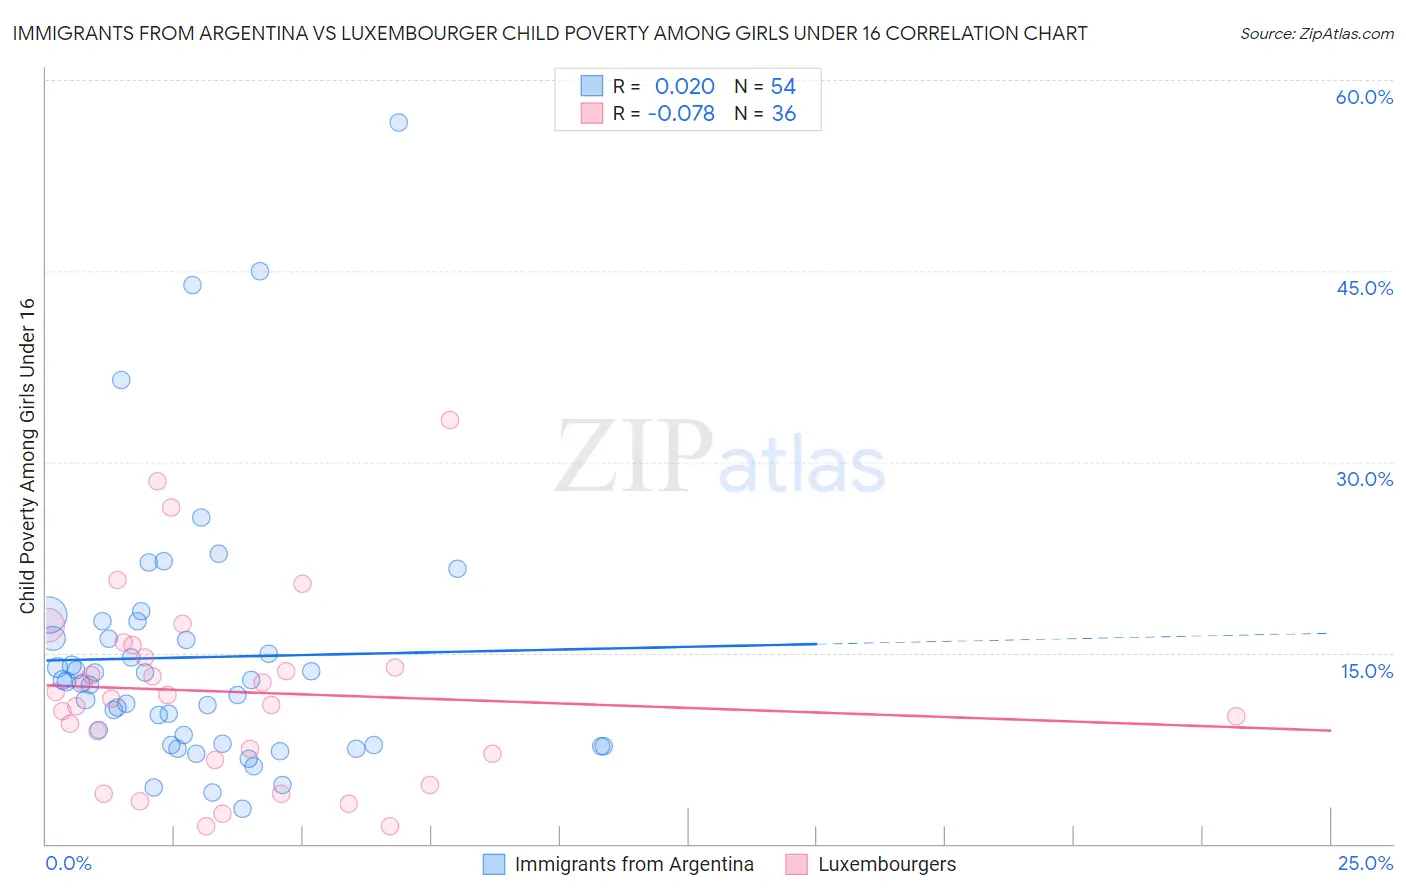
Immigrants from Argentina vs Luxembourger Child Poverty Among Girls Under 16 Correlation Chart
The statistical analysis conducted on geographies consisting of 261,133,430 people shows no correlation between the proportion of Immigrants from Argentina and poverty level among girls under the age of 16 in the United States with a correlation coefficient (R) of 0.020 and weighted average of 14.6%. Similarly, the statistical analysis conducted on geographies consisting of 142,903,603 people shows a slight negative correlation between the proportion of Luxembourgers and poverty level among girls under the age of 16 in the United States with a correlation coefficient (R) of -0.078 and weighted average of 14.3%, a difference of 2.0%.
Child Poverty Among Girls Under 16 Correlation Summary
| Measurement | Immigrants from Argentina | Luxembourger |
| Minimum | 2.8% | 1.4% |
| Maximum | 56.7% | 33.3% |
| Range | 53.9% | 32.0% |
| Mean | 14.6% | 11.9% |
| Median | 12.6% | 11.6% |
| Interquartile 25% (IQ1) | 7.8% | 6.9% |
| Interquartile 75% (IQ3) | 16.1% | 15.2% |
| Interquartile Range (IQR) | 8.4% | 8.3% |
| Standard Deviation (Sample) | 10.3% | 7.4% |
| Standard Deviation (Population) | 10.3% | 7.3% |
Demographics Similar to Immigrants from Argentina and Luxembourgers by Child Poverty Among Girls Under 16
In terms of child poverty among girls under 16, the demographic groups most similar to Immigrants from Argentina are Laotian (14.5%, a difference of 0.15%), Immigrants from Poland (14.6%, a difference of 0.16%), European (14.6%, a difference of 0.28%), Immigrants from Belgium (14.5%, a difference of 0.55%), and Immigrants from Sweden (14.5%, a difference of 0.71%). Similarly, the demographic groups most similar to Luxembourgers are Italian (14.3%, a difference of 0.070%), Immigrants from Pakistan (14.2%, a difference of 0.21%), Estonian (14.3%, a difference of 0.43%), Immigrants from Romania (14.3%, a difference of 0.47%), and Immigrants from Indonesia (14.4%, a difference of 0.54%).
| Demographics | Rating | Rank | Child Poverty Among Girls Under 16 |
| Immigrants | Israel | 99.2 /100 | #50 | Exceptional 14.2% |
| Immigrants | Pakistan | 99.1 /100 | #51 | Exceptional 14.2% |
| Italians | 99.1 /100 | #52 | Exceptional 14.3% |
| Luxembourgers | 99.0 /100 | #53 | Exceptional 14.3% |
| Estonians | 98.9 /100 | #54 | Exceptional 14.3% |
| Immigrants | Romania | 98.9 /100 | #55 | Exceptional 14.3% |
| Immigrants | Indonesia | 98.9 /100 | #56 | Exceptional 14.4% |
| Immigrants | Serbia | 98.9 /100 | #57 | Exceptional 14.4% |
| Immigrants | Bulgaria | 98.8 /100 | #58 | Exceptional 14.4% |
| Zimbabweans | 98.8 /100 | #59 | Exceptional 14.4% |
| Poles | 98.7 /100 | #60 | Exceptional 14.4% |
| Cambodians | 98.7 /100 | #61 | Exceptional 14.4% |
| Scandinavians | 98.7 /100 | #62 | Exceptional 14.4% |
| Immigrants | Europe | 98.7 /100 | #63 | Exceptional 14.4% |
| Immigrants | Philippines | 98.6 /100 | #64 | Exceptional 14.4% |
| Immigrants | Sweden | 98.6 /100 | #65 | Exceptional 14.5% |
| Immigrants | Belgium | 98.5 /100 | #66 | Exceptional 14.5% |
| Laotians | 98.4 /100 | #67 | Exceptional 14.5% |
| Immigrants | Argentina | 98.3 /100 | #68 | Exceptional 14.6% |
| Immigrants | Poland | 98.2 /100 | #69 | Exceptional 14.6% |
| Europeans | 98.1 /100 | #70 | Exceptional 14.6% |