Immigrants from Argentina vs Mexican American Indian Child Poverty Among Girls Under 16
COMPARE
Immigrants from Argentina
Mexican American Indian
Child Poverty Among Girls Under 16
Child Poverty Among Girls Under 16 Comparison
Immigrants from Argentina
Mexican American Indians
14.6%
CHILD POVERTY AMONG GIRLS UNDER 16
98.3/ 100
METRIC RATING
68th/ 347
METRIC RANK
19.5%
CHILD POVERTY AMONG GIRLS UNDER 16
0.2/ 100
METRIC RATING
260th/ 347
METRIC RANK
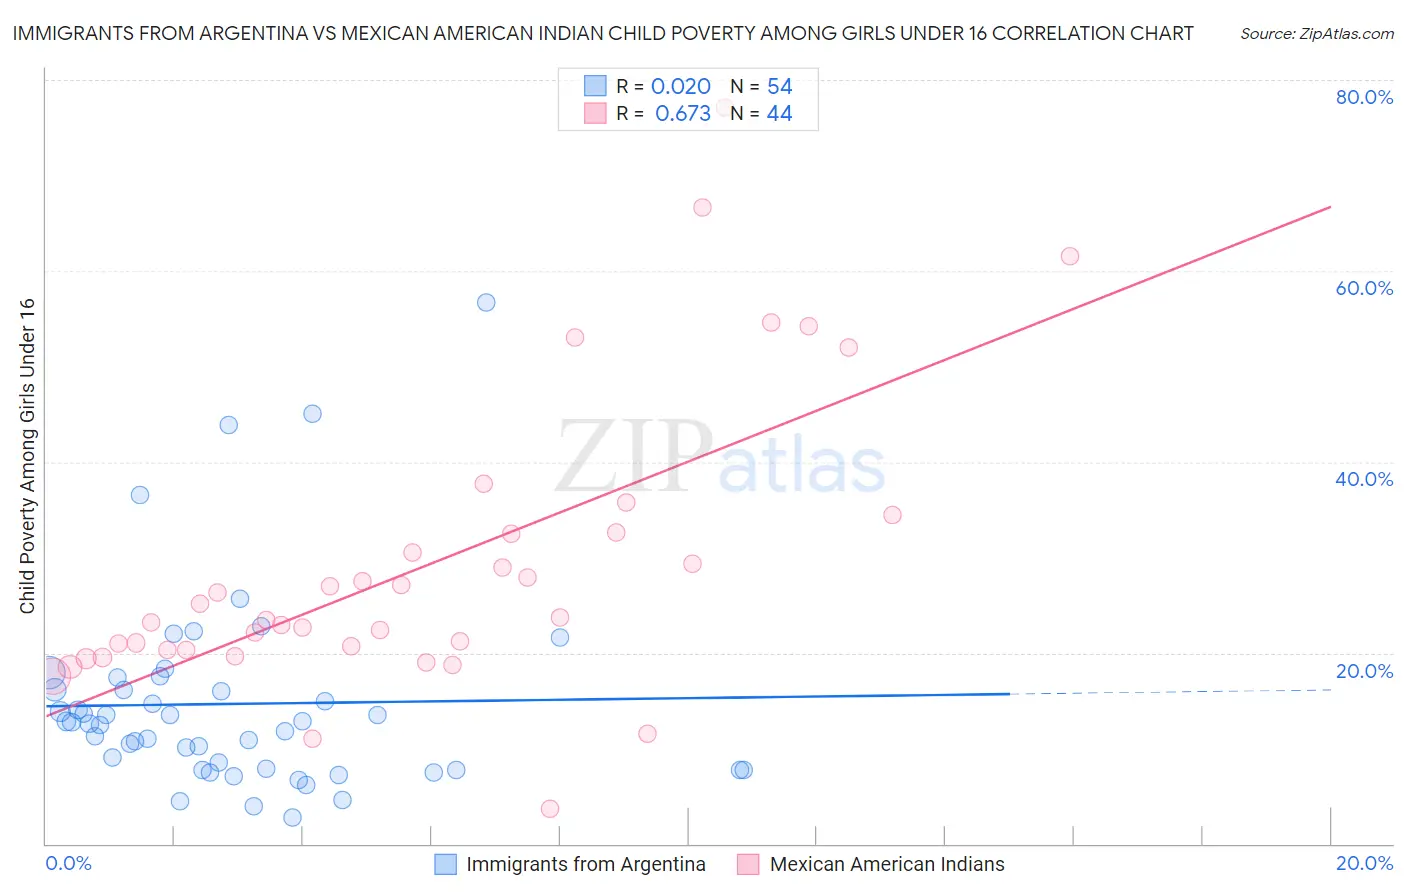
Immigrants from Argentina vs Mexican American Indian Child Poverty Among Girls Under 16 Correlation Chart
The statistical analysis conducted on geographies consisting of 261,133,430 people shows no correlation between the proportion of Immigrants from Argentina and poverty level among girls under the age of 16 in the United States with a correlation coefficient (R) of 0.020 and weighted average of 14.6%. Similarly, the statistical analysis conducted on geographies consisting of 315,250,046 people shows a significant positive correlation between the proportion of Mexican American Indians and poverty level among girls under the age of 16 in the United States with a correlation coefficient (R) of 0.673 and weighted average of 19.5%, a difference of 34.1%.
Child Poverty Among Girls Under 16 Correlation Summary
| Measurement | Immigrants from Argentina | Mexican American Indian |
| Minimum | 2.8% | 3.6% |
| Maximum | 56.7% | 77.1% |
| Range | 53.9% | 73.5% |
| Mean | 14.6% | 29.2% |
| Median | 12.6% | 23.5% |
| Interquartile 25% (IQ1) | 7.8% | 20.3% |
| Interquartile 75% (IQ3) | 16.1% | 32.5% |
| Interquartile Range (IQR) | 8.4% | 12.2% |
| Standard Deviation (Sample) | 10.3% | 15.3% |
| Standard Deviation (Population) | 10.3% | 15.1% |
Similar Demographics by Child Poverty Among Girls Under 16
Demographics Similar to Immigrants from Argentina by Child Poverty Among Girls Under 16
In terms of child poverty among girls under 16, the demographic groups most similar to Immigrants from Argentina are Laotian (14.5%, a difference of 0.15%), Immigrants from Poland (14.6%, a difference of 0.16%), European (14.6%, a difference of 0.28%), Slovene (14.6%, a difference of 0.32%), and Immigrants from Netherlands (14.6%, a difference of 0.34%).
| Demographics | Rating | Rank | Child Poverty Among Girls Under 16 |
| Cambodians | 98.7 /100 | #61 | Exceptional 14.4% |
| Scandinavians | 98.7 /100 | #62 | Exceptional 14.4% |
| Immigrants | Europe | 98.7 /100 | #63 | Exceptional 14.4% |
| Immigrants | Philippines | 98.6 /100 | #64 | Exceptional 14.4% |
| Immigrants | Sweden | 98.6 /100 | #65 | Exceptional 14.5% |
| Immigrants | Belgium | 98.5 /100 | #66 | Exceptional 14.5% |
| Laotians | 98.4 /100 | #67 | Exceptional 14.5% |
| Immigrants | Argentina | 98.3 /100 | #68 | Exceptional 14.6% |
| Immigrants | Poland | 98.2 /100 | #69 | Exceptional 14.6% |
| Europeans | 98.1 /100 | #70 | Exceptional 14.6% |
| Slovenes | 98.1 /100 | #71 | Exceptional 14.6% |
| Immigrants | Netherlands | 98.1 /100 | #72 | Exceptional 14.6% |
| Immigrants | Austria | 98.0 /100 | #73 | Exceptional 14.6% |
| Taiwanese | 98.0 /100 | #74 | Exceptional 14.6% |
| Immigrants | Eastern Europe | 98.0 /100 | #75 | Exceptional 14.6% |
Demographics Similar to Mexican American Indians by Child Poverty Among Girls Under 16
In terms of child poverty among girls under 16, the demographic groups most similar to Mexican American Indians are Vietnamese (19.5%, a difference of 0.090%), Ottawa (19.4%, a difference of 0.58%), Chickasaw (19.6%, a difference of 0.61%), Salvadoran (19.4%, a difference of 0.67%), and Immigrants from Burma/Myanmar (19.7%, a difference of 0.73%).
| Demographics | Rating | Rank | Child Poverty Among Girls Under 16 |
| Immigrants | Guyana | 0.3 /100 | #253 | Tragic 19.3% |
| Immigrants | Western Africa | 0.3 /100 | #254 | Tragic 19.3% |
| Immigrants | Ecuador | 0.3 /100 | #255 | Tragic 19.3% |
| Trinidadians and Tobagonians | 0.2 /100 | #256 | Tragic 19.3% |
| Guyanese | 0.2 /100 | #257 | Tragic 19.4% |
| Salvadorans | 0.2 /100 | #258 | Tragic 19.4% |
| Ottawa | 0.2 /100 | #259 | Tragic 19.4% |
| Mexican American Indians | 0.2 /100 | #260 | Tragic 19.5% |
| Vietnamese | 0.2 /100 | #261 | Tragic 19.5% |
| Chickasaw | 0.1 /100 | #262 | Tragic 19.6% |
| Immigrants | Burma/Myanmar | 0.1 /100 | #263 | Tragic 19.7% |
| Jamaicans | 0.1 /100 | #264 | Tragic 19.7% |
| Immigrants | Jamaica | 0.1 /100 | #265 | Tragic 19.8% |
| Spanish Americans | 0.1 /100 | #266 | Tragic 19.8% |
| Immigrants | Bangladesh | 0.1 /100 | #267 | Tragic 19.9% |