Turkish vs Danish Child Poverty Under the Age of 5

COMPARE

Turkish
Race
Ancestry
AfghanAfricanAlaska NativeAlaskan AthabascanAlbanianAleutAlsatianAmericanApacheArabArapahoArgentineanArmenianAssyrian/Chaldean/SyriacAustralianAustrianBahamianBangladeshiBarbadianBasqueBelgianBelizeanBermudanBhutaneseBlackfeetBolivianBrazilianBritishBritish West IndianBulgarianBurmeseCajunCambodianCanadianCape VerdeanCarpatho RusynCelticCentral AmericanCentral American IndianCherokeeCheyenneChickasawChileanChineseChippewaChoctawColombianColvilleComancheCosta RicanCreeCreekCroatianCrowCubanCypriotCzechCzechoslovakianDelawareDominicanDutchDutch West IndianEastern EuropeanEcuadorianEgyptianEnglishEstonianEthiopianEuropeanFijianFilipinoFinnishFrenchFrench American IndianFrench CanadianGermanGerman RussianGhanaianGreekGuamanian/ChamorroGuatemalanGuyaneseHaitianHmongHonduranHopiHoumaHungarianIcelanderIndian (Asian)IndonesianInupiatIranianIraqiIrishIroquoisIsraeliItalianJamaicanJapaneseJordanianKenyanKiowaKoreanLaotianLatvianLebaneseLiberianLithuanianLumbeeLuxembourgerMacedonianMalaysianMalteseMarshalleseMenomineeMexicanMexican American IndianMongolianMoroccanNative HawaiianNavajoNepaleseNew ZealanderNicaraguanNigerianNorthern EuropeanNorwegianOkinawanOsageOttawaPaiutePakistaniPalestinianPanamanianParaguayanPennsylvania GermanPeruvianPimaPolishPortuguesePotawatomiPuebloPuerto RicanPuget Sound SalishRomanianRussianSalvadoranSamoanScandinavianScotch-IrishScottishSeminoleSenegaleseSerbianShoshoneSierra LeoneanSiouxSlavicSlovakSloveneSomaliSouth AfricanSouth AmericanSouth American IndianSoviet UnionSpaniardSpanishSpanish AmericanSpanish American IndianSri LankanSubsaharan AfricanSudaneseSwedishSwissSyrianTaiwaneseThaiTlingit-HaidaTohono O'OdhamTonganTrinidadian and TobagonianTsimshianTurkishU.S. Virgin IslanderUgandanUkrainianUruguayanUteVenezuelanVietnameseWelshWest IndianYakamaYaquiYugoslavianYumanYup'ikZimbabwean
Immigration
NonimmigrantsImmigrantsAfghanistanAfricaAlbaniaArgentinaArmeniaAsiaAustraliaAustriaBahamasBangladeshBarbadosBelarusBelgiumBelizeBoliviaBosnia and HerzegovinaBrazilBulgariaBurma/MyanmarCabo VerdeCambodiaCameroonCanadaCaribbeanCentral AmericaChileChinaColombiaCongoCosta RicaCroatiaCubaCzechoslovakiaDenmarkDominicaDominican RepublicEastern AfricaEastern AsiaEastern EuropeEcuadorEgyptEl SalvadorEnglandEritreaEthiopiaEuropeFijiFranceGermanyGhanaGreeceGrenadaGuatemalaGuyanaHaitiHondurasHong KongHungaryIndiaIndonesiaIranIraqIrelandIsraelItalyJamaicaJapanJordanKazakhstanKenyaKoreaKuwaitLaosLatin AmericaLatviaLebanonLiberiaLithuaniaMalaysiaMexicoMicronesiaMiddle AfricaMoldovaMoroccoNepalNetherlandsNicaraguaNigeriaNorth AmericaNorth MacedoniaNorthern AfricaNorthern EuropeNorwayOceaniaPakistanPanamaPeruPhilippinesPolandPortugalRomaniaRussiaSaudi ArabiaScotlandSenegalSerbiaSierra LeoneSingaporeSomaliaSouth AfricaSouth AmericaSouth Central AsiaSouth Eastern AsiaSouthern EuropeSpainSri LankaSt. Vincent and the GrenadinesSudanSwedenSwitzerlandSyriaTaiwanThailandTrinidad and TobagoTurkeyUgandaUkraineUruguayUzbekistanVenezuelaVietnamWest IndiesWestern AfricaWestern AsiaWestern EuropeYemenZaireZimbabweAzores
Danish
Race
Ancestry
AfghanAfricanAlaska NativeAlaskan AthabascanAlbanianAleutAlsatianAmericanApacheArabArapahoArgentineanArmenianAssyrian/Chaldean/SyriacAustralianAustrianBahamianBangladeshiBarbadianBasqueBelgianBelizeanBermudanBhutaneseBlackfeetBolivianBrazilianBritishBritish West IndianBulgarianBurmeseCajunCambodianCanadianCape VerdeanCarpatho RusynCelticCentral AmericanCentral American IndianCherokeeCheyenneChickasawChileanChineseChippewaChoctawColombianColvilleComancheCosta RicanCreeCreekCroatianCrowCubanCypriotCzechCzechoslovakianDanishDelawareDominicanDutchDutch West IndianEastern EuropeanEcuadorianEgyptianEnglishEstonianEthiopianEuropeanFijianFilipinoFinnishFrenchFrench American IndianFrench CanadianGermanGerman RussianGhanaianGreekGuamanian/ChamorroGuatemalanGuyaneseHaitianHmongHonduranHopiHoumaHungarianIcelanderIndian (Asian)IndonesianInupiatIranianIraqiIrishIroquoisIsraeliItalianJamaicanJapaneseJordanianKenyanKiowaKoreanLaotianLatvianLebaneseLiberianLithuanianLumbeeLuxembourgerMacedonianMalaysianMalteseMarshalleseMenomineeMexicanMexican American IndianMongolianMoroccanNative HawaiianNavajoNepaleseNew ZealanderNicaraguanNigerianNorthern EuropeanNorwegianOkinawanOsageOttawaPaiutePakistaniPalestinianPanamanianParaguayanPennsylvania GermanPeruvianPimaPolishPortuguesePotawatomiPuebloPuerto RicanPuget Sound SalishRomanianRussianSalvadoranSamoanScandinavianScotch-IrishScottishSeminoleSenegaleseSerbianShoshoneSierra LeoneanSiouxSlavicSlovakSloveneSomaliSouth AfricanSouth AmericanSouth American IndianSoviet UnionSpaniardSpanishSpanish AmericanSpanish American IndianSri LankanSubsaharan AfricanSudaneseSwedishSwissSyrianTaiwaneseThaiTlingit-HaidaTohono O'OdhamTonganTrinidadian and TobagonianTsimshianU.S. Virgin IslanderUgandanUkrainianUruguayanUteVenezuelanVietnameseWelshWest IndianYakamaYaquiYugoslavianYumanYup'ikZimbabwean
Immigration
NonimmigrantsImmigrantsAfghanistanAfricaAlbaniaArgentinaArmeniaAsiaAustraliaAustriaBahamasBangladeshBarbadosBelarusBelgiumBelizeBoliviaBosnia and HerzegovinaBrazilBulgariaBurma/MyanmarCabo VerdeCambodiaCameroonCanadaCaribbeanCentral AmericaChileChinaColombiaCongoCosta RicaCroatiaCubaCzechoslovakiaDenmarkDominicaDominican RepublicEastern AfricaEastern AsiaEastern EuropeEcuadorEgyptEl SalvadorEnglandEritreaEthiopiaEuropeFijiFranceGermanyGhanaGreeceGrenadaGuatemalaGuyanaHaitiHondurasHong KongHungaryIndiaIndonesiaIranIraqIrelandIsraelItalyJamaicaJapanJordanKazakhstanKenyaKoreaKuwaitLaosLatin AmericaLatviaLebanonLiberiaLithuaniaMalaysiaMexicoMicronesiaMiddle AfricaMoldovaMoroccoNepalNetherlandsNicaraguaNigeriaNorth AmericaNorth MacedoniaNorthern AfricaNorthern EuropeNorwayOceaniaPakistanPanamaPeruPhilippinesPolandPortugalRomaniaRussiaSaudi ArabiaScotlandSenegalSerbiaSierra LeoneSingaporeSomaliaSouth AfricaSouth AmericaSouth Central AsiaSouth Eastern AsiaSouthern EuropeSpainSri LankaSt. Vincent and the GrenadinesSudanSwedenSwitzerlandSyriaTaiwanThailandTrinidad and TobagoTurkeyUgandaUkraineUruguayUzbekistanVenezuelaVietnamWest IndiesWestern AfricaWestern AsiaWestern EuropeYemenZaireZimbabweAzores
Child Poverty Under the Age of 5
Income
Poverty
Unemployment
Labor Participation
Family Structure
Vehicle Availability
Education Level
Disability

Child Poverty Under the Age of 5 Comparison

Turks

Danes

Exceptional
Exceptional
14.6%
CHILD POVERTY UNDER THE AGE OF 5
99.7/ 100
METRIC RATING
37th/ 347
METRIC RANK
14.9%
CHILD POVERTY UNDER THE AGE OF 5
99.4/ 100
METRIC RATING
55th/ 347
METRIC RANK

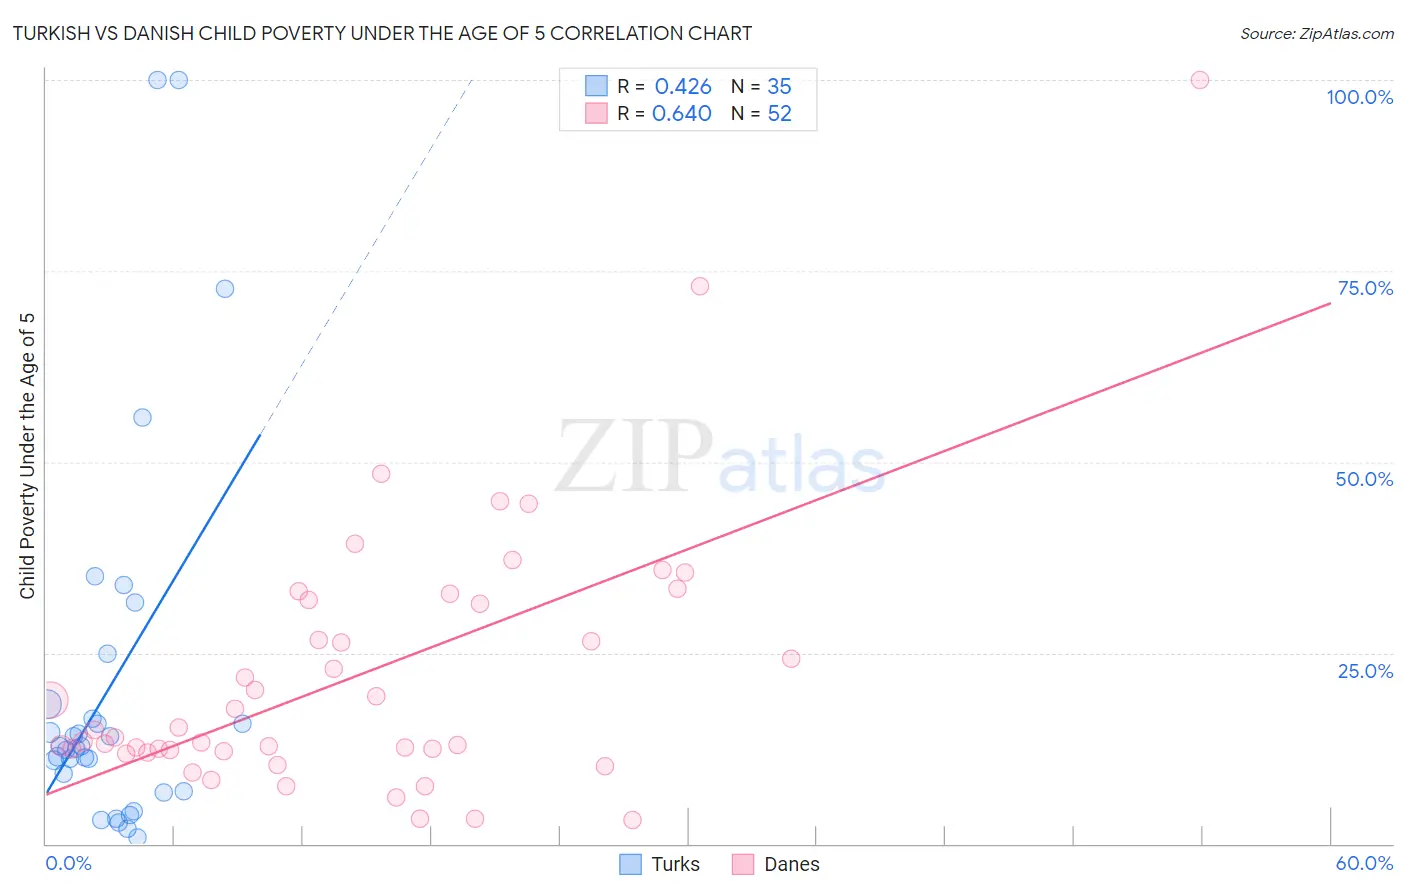
Turkish vs Danish Child Poverty Under the Age of 5 Correlation Chart

The statistical analysis conducted on geographies consisting of 261,582,938 people shows a moderate positive correlation between the proportion of Turks and poverty level among children under the age of 5 in the United States with a correlation coefficient (R) of 0.426 and weighted average of 14.6%. Similarly, the statistical analysis conducted on geographies consisting of 447,094,806 people shows a significant positive correlation between the proportion of Danes and poverty level among children under the age of 5 in the United States with a correlation coefficient (R) of 0.640 and weighted average of 14.9%, a difference of 2.5%.
Turkish vs Danish Child Poverty Under the Age of 5

Child Poverty Under the Age of 5 Correlation Summary

MeasurementTurkishDanish
Minimum0.87%3.2%
Maximum100.0%100.0%
Range99.1%96.8%
Mean20.7%22.1%
Median12.7%14.4%
Interquartile 25% (IQ1)6.9%12.2%
Interquartile 75% (IQ3)18.3%31.7%
Interquartile Range (IQR)11.4%19.5%
Standard Deviation (Sample)24.7%17.6%
Standard Deviation (Population)24.3%17.5%

Demographics Similar to Turks and Danes by Child Poverty Under the Age of 5

In terms of child poverty under the age of 5, the demographic groups most similar to Turks are Eastern European (14.6%, a difference of 0.27%), Norwegian (14.6%, a difference of 0.27%), Maltese (14.5%, a difference of 0.34%), Immigrants from Australia (14.6%, a difference of 0.56%), and Immigrants from Belarus (14.7%, a difference of 0.68%). Similarly, the demographic groups most similar to Danes are Immigrants from Israel (14.9%, a difference of 0.060%), Luxembourger (14.9%, a difference of 0.070%), Immigrants from Pakistan (14.9%, a difference of 0.070%), Immigrants from Serbia (14.9%, a difference of 0.23%), and Estonian (14.8%, a difference of 0.76%).
DemographicsRating | RankChild Poverty Under the Age of 5
Maltese
99.8
/100
|
#36
Exceptional
14.5%
Turks
99.7
/100
|
#37
Exceptional
14.6%
Eastern Europeans
99.7
/100
|
#38
Exceptional
14.6%
Norwegians
99.7
/100
|
#39
Exceptional
14.6%
Immigrants | Australia
99.7
/100
|
#40
Exceptional
14.6%
Immigrants | Belarus
99.7
/100
|
#41
Exceptional
14.7%
Soviet Union
99.7
/100
|
#42
Exceptional
14.7%
Immigrants | Greece
99.7
/100
|
#43
Exceptional
14.7%
Immigrants | Philippines
99.7
/100
|
#44
Exceptional
14.7%
Laotians
99.6
/100
|
#45
Exceptional
14.7%
Tsimshian
99.6
/100
|
#46
Exceptional
14.7%
Russians
99.6
/100
|
#47
Exceptional
14.8%
Immigrants | Czechoslovakia
99.6
/100
|
#48
Exceptional
14.8%
Immigrants | Bulgaria
99.6
/100
|
#49
Exceptional
14.8%
Immigrants | Northern Europe
99.6
/100
|
#50
Exceptional
14.8%
Estonians
99.6
/100
|
#51
Exceptional
14.8%
Immigrants | Serbia
99.5
/100
|
#52
Exceptional
14.9%
Luxembourgers
99.4
/100
|
#53
Exceptional
14.9%
Immigrants | Israel
99.4
/100
|
#54
Exceptional
14.9%
Danes
99.4
/100
|
#55
Exceptional
14.9%
Immigrants | Pakistan
99.4
/100
|
#56
Exceptional
14.9%