Immigrants from Argentina vs Immigrants from Lithuania Family Poverty
COMPARE
Immigrants from Argentina
Immigrants from Lithuania
Family Poverty
Family Poverty Comparison
Immigrants from Argentina
Immigrants from Lithuania
8.4%
FAMILY POVERTY
88.2/ 100
METRIC RATING
132nd/ 347
METRIC RANK
7.2%
FAMILY POVERTY
99.8/ 100
METRIC RATING
18th/ 347
METRIC RANK
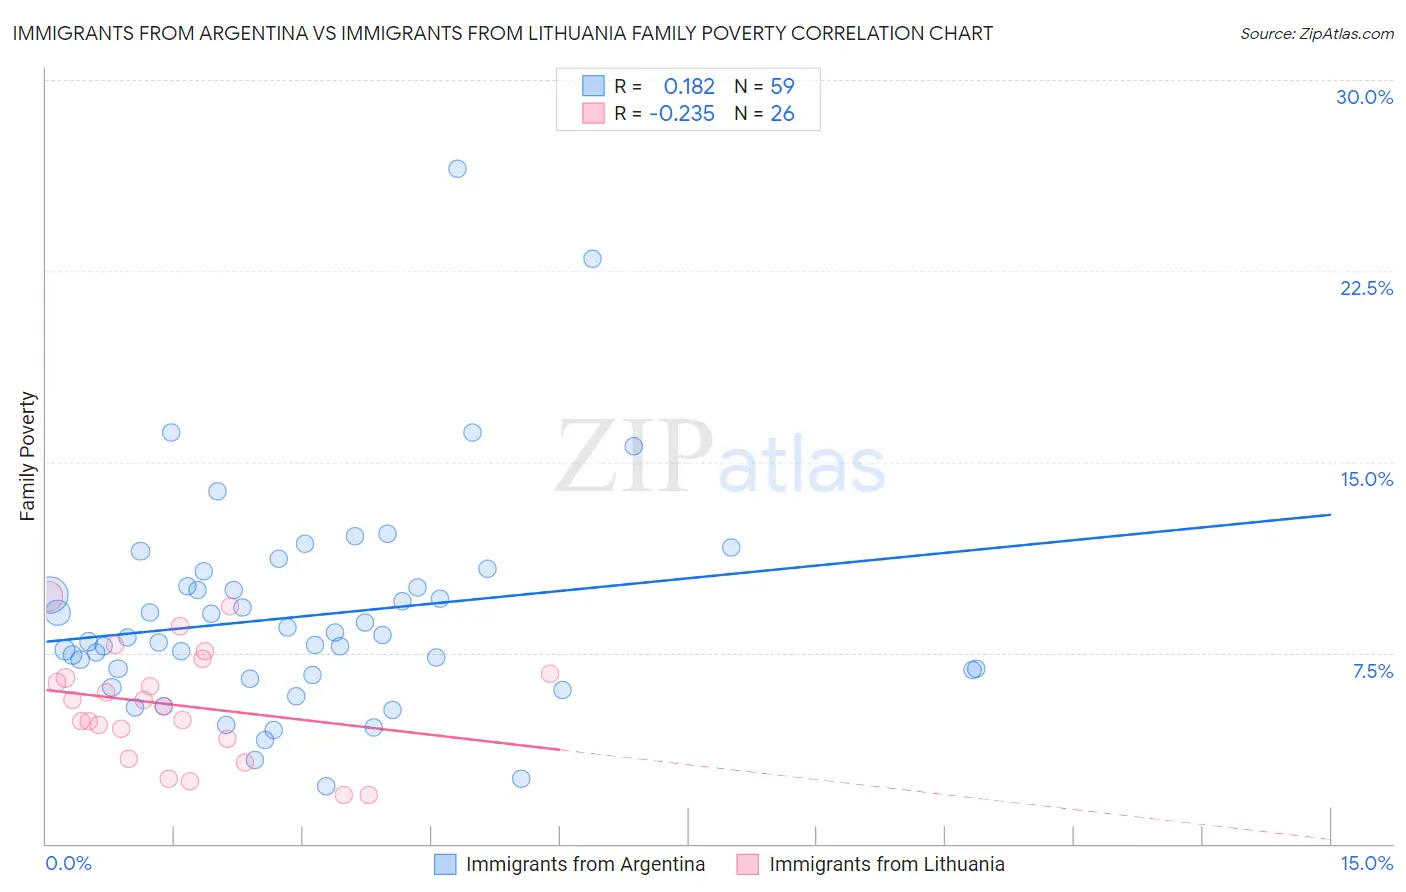
Immigrants from Argentina vs Immigrants from Lithuania Family Poverty Correlation Chart
The statistical analysis conducted on geographies consisting of 264,069,938 people shows a poor positive correlation between the proportion of Immigrants from Argentina and poverty level among families in the United States with a correlation coefficient (R) of 0.182 and weighted average of 8.4%. Similarly, the statistical analysis conducted on geographies consisting of 117,605,958 people shows a weak negative correlation between the proportion of Immigrants from Lithuania and poverty level among families in the United States with a correlation coefficient (R) of -0.235 and weighted average of 7.2%, a difference of 16.5%.
Family Poverty Correlation Summary
| Measurement | Immigrants from Argentina | Immigrants from Lithuania |
| Minimum | 2.3% | 1.9% |
| Maximum | 26.5% | 9.7% |
| Range | 24.3% | 7.8% |
| Mean | 8.9% | 5.5% |
| Median | 8.1% | 5.5% |
| Interquartile 25% (IQ1) | 6.6% | 4.1% |
| Interquartile 75% (IQ3) | 10.1% | 6.7% |
| Interquartile Range (IQR) | 3.5% | 2.5% |
| Standard Deviation (Sample) | 4.3% | 2.2% |
| Standard Deviation (Population) | 4.2% | 2.1% |
Similar Demographics by Family Poverty
Demographics Similar to Immigrants from Argentina by Family Poverty
In terms of family poverty, the demographic groups most similar to Immigrants from Argentina are Puget Sound Salish (8.4%, a difference of 0.15%), Immigrants from Bosnia and Herzegovina (8.4%, a difference of 0.16%), Portuguese (8.4%, a difference of 0.34%), Argentinean (8.4%, a difference of 0.49%), and Sri Lankan (8.5%, a difference of 0.50%).
| Demographics | Rating | Rank | Family Poverty |
| Pakistanis | 90.8 /100 | #125 | Exceptional 8.3% |
| Icelanders | 90.3 /100 | #126 | Exceptional 8.3% |
| Immigrants | Hungary | 89.9 /100 | #127 | Excellent 8.4% |
| Argentineans | 89.6 /100 | #128 | Excellent 8.4% |
| Portuguese | 89.2 /100 | #129 | Excellent 8.4% |
| Immigrants | Bosnia and Herzegovina | 88.6 /100 | #130 | Excellent 8.4% |
| Puget Sound Salish | 88.6 /100 | #131 | Excellent 8.4% |
| Immigrants | Argentina | 88.2 /100 | #132 | Excellent 8.4% |
| Sri Lankans | 86.6 /100 | #133 | Excellent 8.5% |
| Chileans | 86.6 /100 | #134 | Excellent 8.5% |
| Immigrants | Malaysia | 86.5 /100 | #135 | Excellent 8.5% |
| Immigrants | Brazil | 86.3 /100 | #136 | Excellent 8.5% |
| Immigrants | Southern Europe | 86.0 /100 | #137 | Excellent 8.5% |
| Armenians | 84.6 /100 | #138 | Excellent 8.5% |
| Immigrants | Nepal | 84.2 /100 | #139 | Excellent 8.5% |
Demographics Similar to Immigrants from Lithuania by Family Poverty
In terms of family poverty, the demographic groups most similar to Immigrants from Lithuania are Luxembourger (7.2%, a difference of 0.010%), Immigrants from South Central Asia (7.2%, a difference of 0.24%), Eastern European (7.2%, a difference of 0.30%), Immigrants from Hong Kong (7.3%, a difference of 0.46%), and Lithuanian (7.2%, a difference of 0.51%).
| Demographics | Rating | Rank | Family Poverty |
| Immigrants | Singapore | 99.8 /100 | #11 | Exceptional 7.1% |
| Maltese | 99.8 /100 | #12 | Exceptional 7.1% |
| Swedes | 99.8 /100 | #13 | Exceptional 7.1% |
| Iranians | 99.8 /100 | #14 | Exceptional 7.1% |
| Lithuanians | 99.8 /100 | #15 | Exceptional 7.2% |
| Immigrants | South Central Asia | 99.8 /100 | #16 | Exceptional 7.2% |
| Luxembourgers | 99.8 /100 | #17 | Exceptional 7.2% |
| Immigrants | Lithuania | 99.8 /100 | #18 | Exceptional 7.2% |
| Eastern Europeans | 99.7 /100 | #19 | Exceptional 7.2% |
| Immigrants | Hong Kong | 99.7 /100 | #20 | Exceptional 7.3% |
| Immigrants | Iran | 99.7 /100 | #21 | Exceptional 7.3% |
| Danes | 99.7 /100 | #22 | Exceptional 7.3% |
| Assyrians/Chaldeans/Syriacs | 99.7 /100 | #23 | Exceptional 7.3% |
| Croatians | 99.7 /100 | #24 | Exceptional 7.3% |
| Burmese | 99.7 /100 | #25 | Exceptional 7.3% |