Immigrants from Argentina vs Basque 12th Grade, No Diploma
COMPARE
Immigrants from Argentina
Basque
12th Grade, No Diploma
12th Grade, No Diploma Comparison
Immigrants from Argentina
Basques
91.6%
12TH GRADE, NO DIPLOMA
80.7/ 100
METRIC RATING
143rd/ 347
METRIC RANK
91.8%
12TH GRADE, NO DIPLOMA
91.3/ 100
METRIC RATING
126th/ 347
METRIC RANK
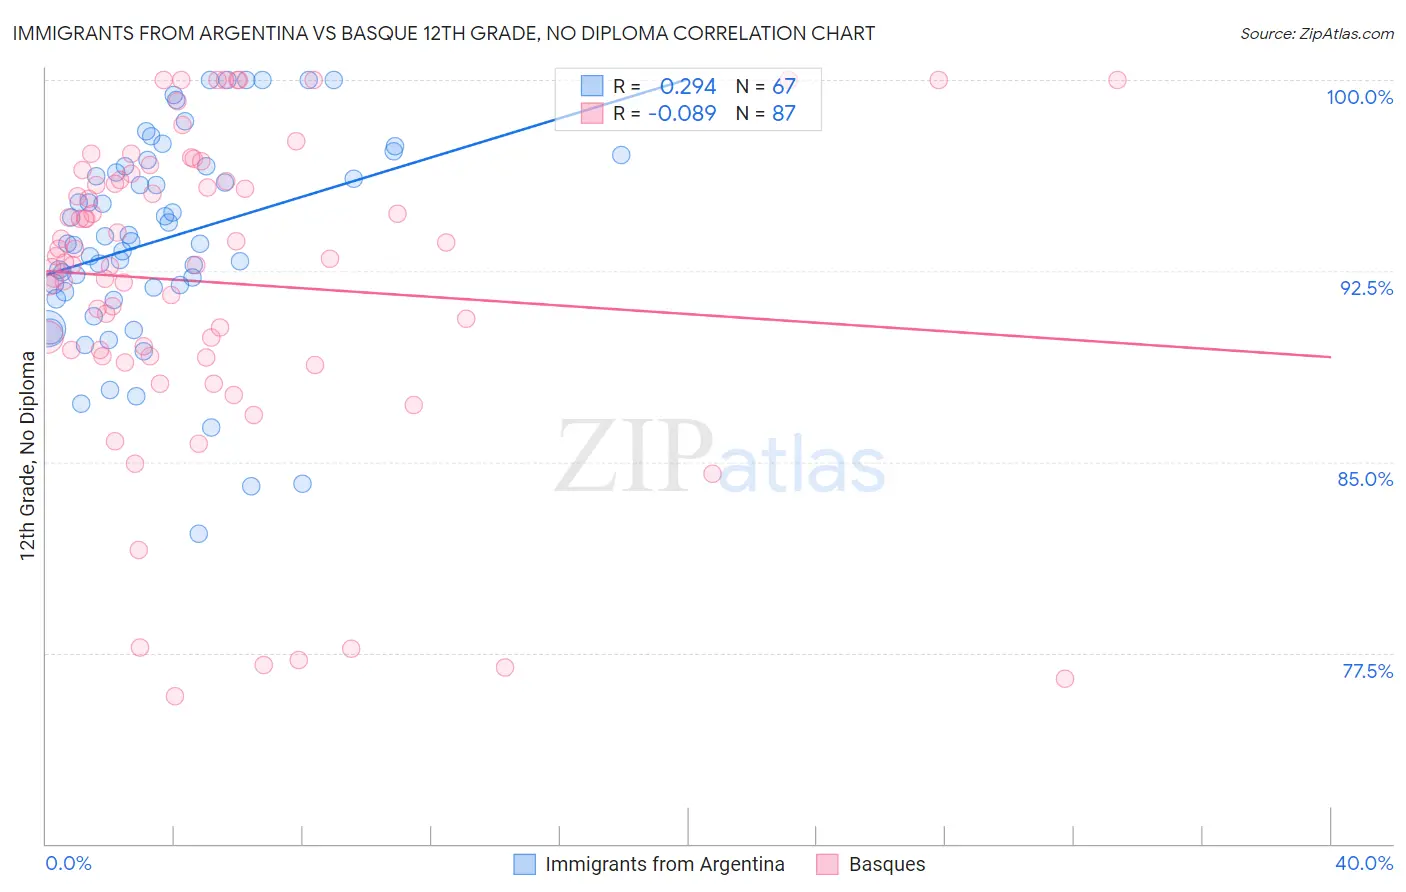
Immigrants from Argentina vs Basque 12th Grade, No Diploma Correlation Chart
The statistical analysis conducted on geographies consisting of 264,434,241 people shows a weak positive correlation between the proportion of Immigrants from Argentina and percentage of population with at least 12th grade (no diploma) education in the United States with a correlation coefficient (R) of 0.294 and weighted average of 91.6%. Similarly, the statistical analysis conducted on geographies consisting of 165,778,750 people shows a slight negative correlation between the proportion of Basques and percentage of population with at least 12th grade (no diploma) education in the United States with a correlation coefficient (R) of -0.089 and weighted average of 91.8%, a difference of 0.28%.
12th Grade, No Diploma Correlation Summary
| Measurement | Immigrants from Argentina | Basque |
| Minimum | 82.2% | 75.8% |
| Maximum | 100.0% | 100.0% |
| Range | 17.8% | 24.2% |
| Mean | 93.8% | 92.1% |
| Median | 93.7% | 93.0% |
| Interquartile 25% (IQ1) | 91.7% | 89.1% |
| Interquartile 75% (IQ3) | 96.6% | 96.1% |
| Interquartile Range (IQR) | 4.9% | 6.9% |
| Standard Deviation (Sample) | 4.1% | 6.1% |
| Standard Deviation (Population) | 4.0% | 6.1% |
Demographics Similar to Immigrants from Argentina and Basques by 12th Grade, No Diploma
In terms of 12th grade, no diploma, the demographic groups most similar to Immigrants from Argentina are Immigrants from Venezuela (91.6%, a difference of 0.0%), Immigrants from Spain (91.6%, a difference of 0.010%), Immigrants from Poland (91.6%, a difference of 0.030%), Argentinean (91.6%, a difference of 0.030%), and Arab (91.6%, a difference of 0.070%). Similarly, the demographic groups most similar to Basques are Immigrants from Ukraine (91.8%, a difference of 0.010%), White/Caucasian (91.8%, a difference of 0.010%), Immigrants from Jordan (91.8%, a difference of 0.010%), Mongolian (91.8%, a difference of 0.050%), and German Russian (91.8%, a difference of 0.050%).
| Demographics | Rating | Rank | 12th Grade, No Diploma |
| Immigrants | Ukraine | 91.6 /100 | #124 | Exceptional 91.8% |
| Whites/Caucasians | 91.6 /100 | #125 | Exceptional 91.8% |
| Basques | 91.3 /100 | #126 | Exceptional 91.8% |
| Immigrants | Jordan | 91.0 /100 | #127 | Exceptional 91.8% |
| Mongolians | 89.9 /100 | #128 | Excellent 91.8% |
| German Russians | 89.8 /100 | #129 | Excellent 91.8% |
| Assyrians/Chaldeans/Syriacs | 89.6 /100 | #130 | Excellent 91.8% |
| Albanians | 89.3 /100 | #131 | Excellent 91.8% |
| Immigrants | Eastern Asia | 89.3 /100 | #132 | Excellent 91.8% |
| Immigrants | Italy | 88.3 /100 | #133 | Excellent 91.7% |
| Venezuelans | 88.2 /100 | #134 | Excellent 91.7% |
| Immigrants | Bosnia and Herzegovina | 87.3 /100 | #135 | Excellent 91.7% |
| Chileans | 85.8 /100 | #136 | Excellent 91.7% |
| Alaska Natives | 84.9 /100 | #137 | Excellent 91.6% |
| Arabs | 84.1 /100 | #138 | Excellent 91.6% |
| Immigrants | Egypt | 83.9 /100 | #139 | Excellent 91.6% |
| Immigrants | Poland | 82.3 /100 | #140 | Excellent 91.6% |
| Argentineans | 82.0 /100 | #141 | Excellent 91.6% |
| Immigrants | Venezuela | 80.9 /100 | #142 | Excellent 91.6% |
| Immigrants | Argentina | 80.7 /100 | #143 | Excellent 91.6% |
| Immigrants | Spain | 80.1 /100 | #144 | Excellent 91.6% |