Immigrants from Albania vs Immigrants from Uganda Family Poverty
COMPARE
Immigrants from Albania
Immigrants from Uganda
Family Poverty
Family Poverty Comparison
Immigrants from Albania
Immigrants from Uganda
9.0%
FAMILY POVERTY
50.0/ 100
METRIC RATING
174th/ 347
METRIC RANK
9.1%
FAMILY POVERTY
43.4/ 100
METRIC RATING
180th/ 347
METRIC RANK
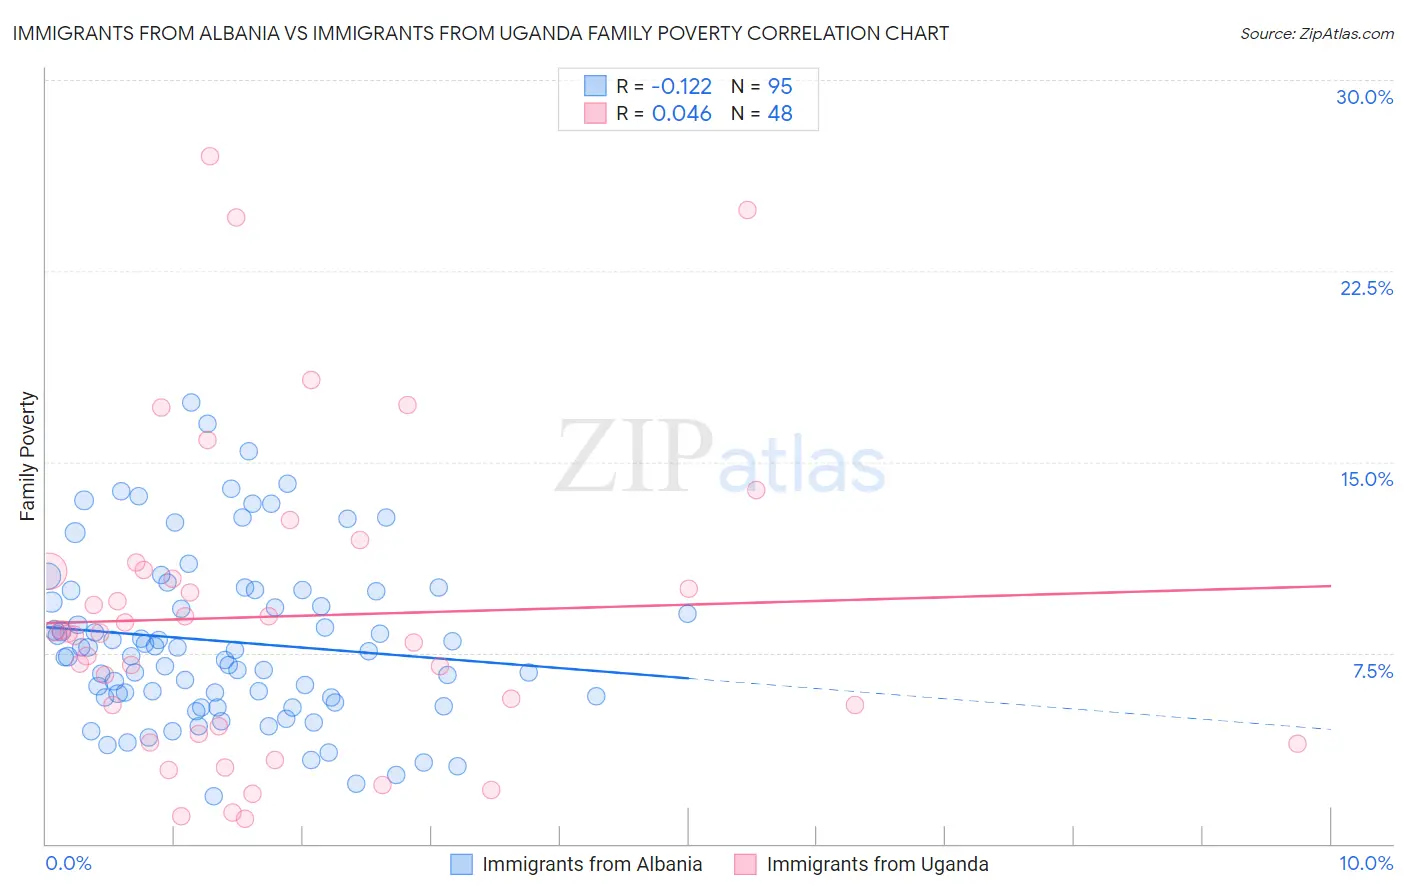
Immigrants from Albania vs Immigrants from Uganda Family Poverty Correlation Chart
The statistical analysis conducted on geographies consisting of 119,258,186 people shows a poor negative correlation between the proportion of Immigrants from Albania and poverty level among families in the United States with a correlation coefficient (R) of -0.122 and weighted average of 9.0%. Similarly, the statistical analysis conducted on geographies consisting of 125,892,815 people shows no correlation between the proportion of Immigrants from Uganda and poverty level among families in the United States with a correlation coefficient (R) of 0.046 and weighted average of 9.1%, a difference of 0.87%.
Family Poverty Correlation Summary
| Measurement | Immigrants from Albania | Immigrants from Uganda |
| Minimum | 1.8% | 1.0% |
| Maximum | 17.3% | 27.0% |
| Range | 15.5% | 26.0% |
| Mean | 7.9% | 8.9% |
| Median | 7.5% | 8.3% |
| Interquartile 25% (IQ1) | 5.7% | 4.5% |
| Interquartile 75% (IQ3) | 10.0% | 10.7% |
| Interquartile Range (IQR) | 4.2% | 6.3% |
| Standard Deviation (Sample) | 3.3% | 6.1% |
| Standard Deviation (Population) | 3.3% | 6.0% |
Demographics Similar to Immigrants from Albania and Immigrants from Uganda by Family Poverty
In terms of family poverty, the demographic groups most similar to Immigrants from Albania are Costa Rican (9.0%, a difference of 0.090%), Immigrants from Syria (9.0%, a difference of 0.33%), Hawaiian (9.0%, a difference of 0.36%), Immigrants from Cameroon (9.0%, a difference of 0.37%), and Immigrants from Iraq (9.1%, a difference of 0.74%). Similarly, the demographic groups most similar to Immigrants from Uganda are Immigrants from Iraq (9.1%, a difference of 0.13%), Hmong (9.1%, a difference of 0.43%), Immigrants from Morocco (9.1%, a difference of 0.43%), Immigrants from Cameroon (9.0%, a difference of 0.49%), and Hawaiian (9.0%, a difference of 0.50%).
| Demographics | Rating | Rank | Family Poverty |
| Immigrants | Ethiopia | 62.5 /100 | #167 | Good 8.9% |
| Israelis | 62.1 /100 | #168 | Good 8.9% |
| Immigrants | Chile | 59.6 /100 | #169 | Average 8.9% |
| Kenyans | 58.2 /100 | #170 | Average 8.9% |
| Lebanese | 57.6 /100 | #171 | Average 8.9% |
| Immigrants | Peru | 57.5 /100 | #172 | Average 8.9% |
| Immigrants | Fiji | 56.4 /100 | #173 | Average 8.9% |
| Immigrants | Albania | 50.0 /100 | #174 | Average 9.0% |
| Costa Ricans | 49.3 /100 | #175 | Average 9.0% |
| Immigrants | Syria | 47.5 /100 | #176 | Average 9.0% |
| Hawaiians | 47.2 /100 | #177 | Average 9.0% |
| Immigrants | Cameroon | 47.1 /100 | #178 | Average 9.0% |
| Immigrants | Iraq | 44.4 /100 | #179 | Average 9.1% |
| Immigrants | Uganda | 43.4 /100 | #180 | Average 9.1% |
| Hmong | 40.2 /100 | #181 | Average 9.1% |
| Immigrants | Morocco | 40.2 /100 | #182 | Average 9.1% |
| Uruguayans | 39.2 /100 | #183 | Fair 9.1% |
| South American Indians | 38.7 /100 | #184 | Fair 9.1% |
| Immigrants | Saudi Arabia | 38.6 /100 | #185 | Fair 9.1% |
| Colombians | 36.1 /100 | #186 | Fair 9.2% |
| Delaware | 35.4 /100 | #187 | Fair 9.2% |