Immigrants from Albania vs Assyrian/Chaldean/Syriac Family Poverty
COMPARE
Immigrants from Albania
Assyrian/Chaldean/Syriac
Family Poverty
Family Poverty Comparison
Immigrants from Albania
Assyrians/Chaldeans/Syriacs
9.0%
FAMILY POVERTY
50.0/ 100
METRIC RATING
174th/ 347
METRIC RANK
7.3%
FAMILY POVERTY
99.7/ 100
METRIC RATING
23rd/ 347
METRIC RANK
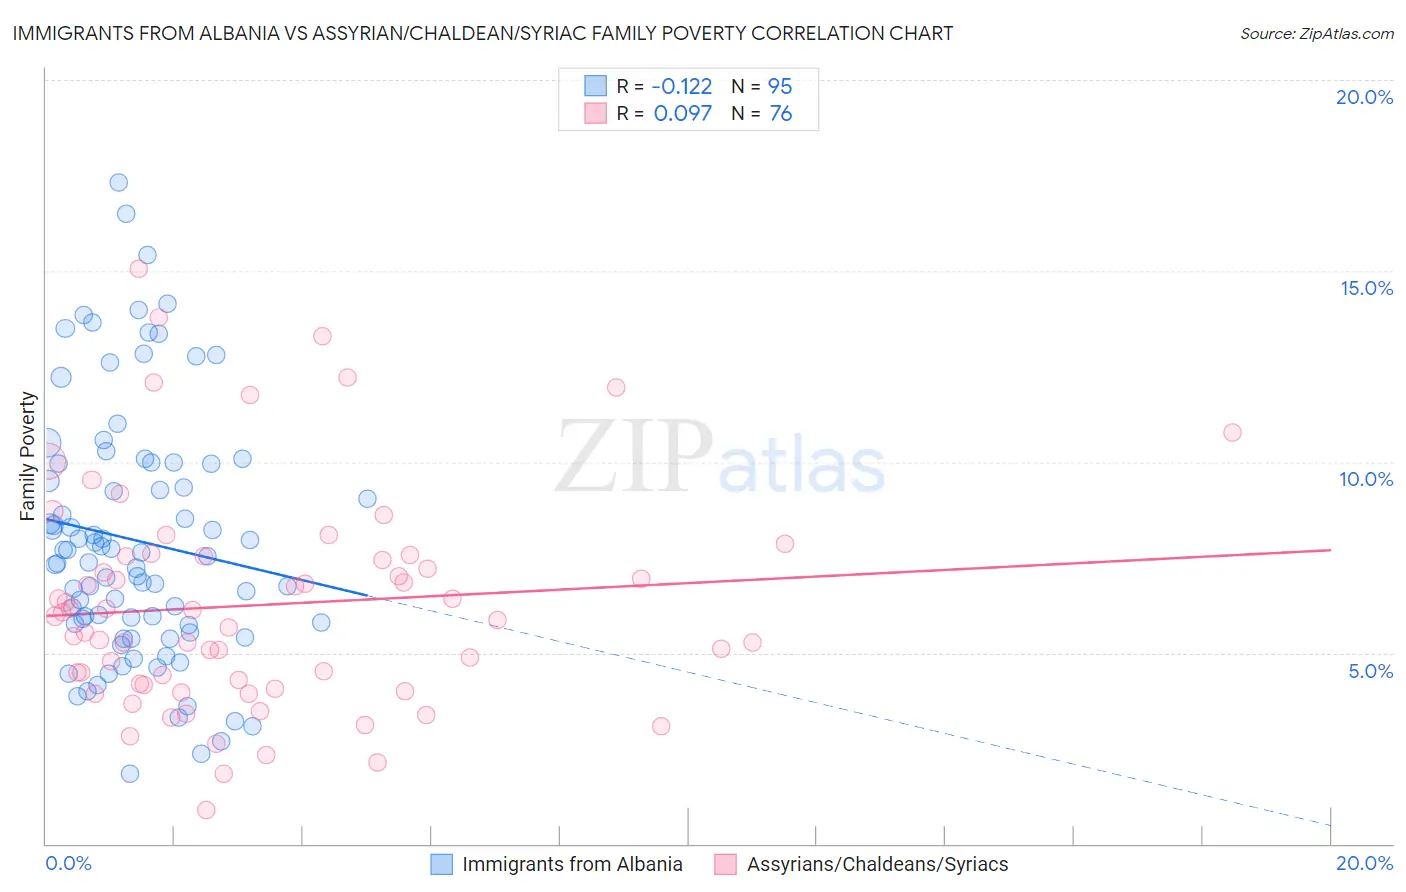
Immigrants from Albania vs Assyrian/Chaldean/Syriac Family Poverty Correlation Chart
The statistical analysis conducted on geographies consisting of 119,258,186 people shows a poor negative correlation between the proportion of Immigrants from Albania and poverty level among families in the United States with a correlation coefficient (R) of -0.122 and weighted average of 9.0%. Similarly, the statistical analysis conducted on geographies consisting of 110,238,893 people shows a slight positive correlation between the proportion of Assyrians/Chaldeans/Syriacs and poverty level among families in the United States with a correlation coefficient (R) of 0.097 and weighted average of 7.3%, a difference of 23.3%.
Family Poverty Correlation Summary
| Measurement | Immigrants from Albania | Assyrian/Chaldean/Syriac |
| Minimum | 1.8% | 0.89% |
| Maximum | 17.3% | 15.1% |
| Range | 15.5% | 14.2% |
| Mean | 7.9% | 6.3% |
| Median | 7.5% | 5.9% |
| Interquartile 25% (IQ1) | 5.7% | 4.2% |
| Interquartile 75% (IQ3) | 10.0% | 7.5% |
| Interquartile Range (IQR) | 4.2% | 3.3% |
| Standard Deviation (Sample) | 3.3% | 2.9% |
| Standard Deviation (Population) | 3.3% | 2.9% |
Similar Demographics by Family Poverty
Demographics Similar to Immigrants from Albania by Family Poverty
In terms of family poverty, the demographic groups most similar to Immigrants from Albania are Costa Rican (9.0%, a difference of 0.090%), Immigrants from Syria (9.0%, a difference of 0.33%), Hawaiian (9.0%, a difference of 0.36%), Immigrants from Cameroon (9.0%, a difference of 0.37%), and Immigrants from Iraq (9.1%, a difference of 0.74%).
| Demographics | Rating | Rank | Family Poverty |
| Immigrants | Ethiopia | 62.5 /100 | #167 | Good 8.9% |
| Israelis | 62.1 /100 | #168 | Good 8.9% |
| Immigrants | Chile | 59.6 /100 | #169 | Average 8.9% |
| Kenyans | 58.2 /100 | #170 | Average 8.9% |
| Lebanese | 57.6 /100 | #171 | Average 8.9% |
| Immigrants | Peru | 57.5 /100 | #172 | Average 8.9% |
| Immigrants | Fiji | 56.4 /100 | #173 | Average 8.9% |
| Immigrants | Albania | 50.0 /100 | #174 | Average 9.0% |
| Costa Ricans | 49.3 /100 | #175 | Average 9.0% |
| Immigrants | Syria | 47.5 /100 | #176 | Average 9.0% |
| Hawaiians | 47.2 /100 | #177 | Average 9.0% |
| Immigrants | Cameroon | 47.1 /100 | #178 | Average 9.0% |
| Immigrants | Iraq | 44.4 /100 | #179 | Average 9.1% |
| Immigrants | Uganda | 43.4 /100 | #180 | Average 9.1% |
| Hmong | 40.2 /100 | #181 | Average 9.1% |
Demographics Similar to Assyrians/Chaldeans/Syriacs by Family Poverty
In terms of family poverty, the demographic groups most similar to Assyrians/Chaldeans/Syriacs are Danish (7.3%, a difference of 0.010%), Croatian (7.3%, a difference of 0.30%), Burmese (7.3%, a difference of 0.30%), Immigrants from Iran (7.3%, a difference of 0.45%), and Cypriot (7.3%, a difference of 0.55%).
| Demographics | Rating | Rank | Family Poverty |
| Immigrants | South Central Asia | 99.8 /100 | #16 | Exceptional 7.2% |
| Luxembourgers | 99.8 /100 | #17 | Exceptional 7.2% |
| Immigrants | Lithuania | 99.8 /100 | #18 | Exceptional 7.2% |
| Eastern Europeans | 99.7 /100 | #19 | Exceptional 7.2% |
| Immigrants | Hong Kong | 99.7 /100 | #20 | Exceptional 7.3% |
| Immigrants | Iran | 99.7 /100 | #21 | Exceptional 7.3% |
| Danes | 99.7 /100 | #22 | Exceptional 7.3% |
| Assyrians/Chaldeans/Syriacs | 99.7 /100 | #23 | Exceptional 7.3% |
| Croatians | 99.7 /100 | #24 | Exceptional 7.3% |
| Burmese | 99.7 /100 | #25 | Exceptional 7.3% |
| Cypriots | 99.6 /100 | #26 | Exceptional 7.3% |
| Immigrants | Scotland | 99.6 /100 | #27 | Exceptional 7.3% |
| Immigrants | Korea | 99.6 /100 | #28 | Exceptional 7.4% |
| Immigrants | Northern Europe | 99.6 /100 | #29 | Exceptional 7.4% |
| Italians | 99.6 /100 | #30 | Exceptional 7.4% |