Immigrants from Albania vs South American Family Poverty
COMPARE
Immigrants from Albania
South American
Family Poverty
Family Poverty Comparison
Immigrants from Albania
South Americans
9.0%
FAMILY POVERTY
50.0/ 100
METRIC RATING
174th/ 347
METRIC RANK
9.3%
FAMILY POVERTY
28.1/ 100
METRIC RATING
194th/ 347
METRIC RANK
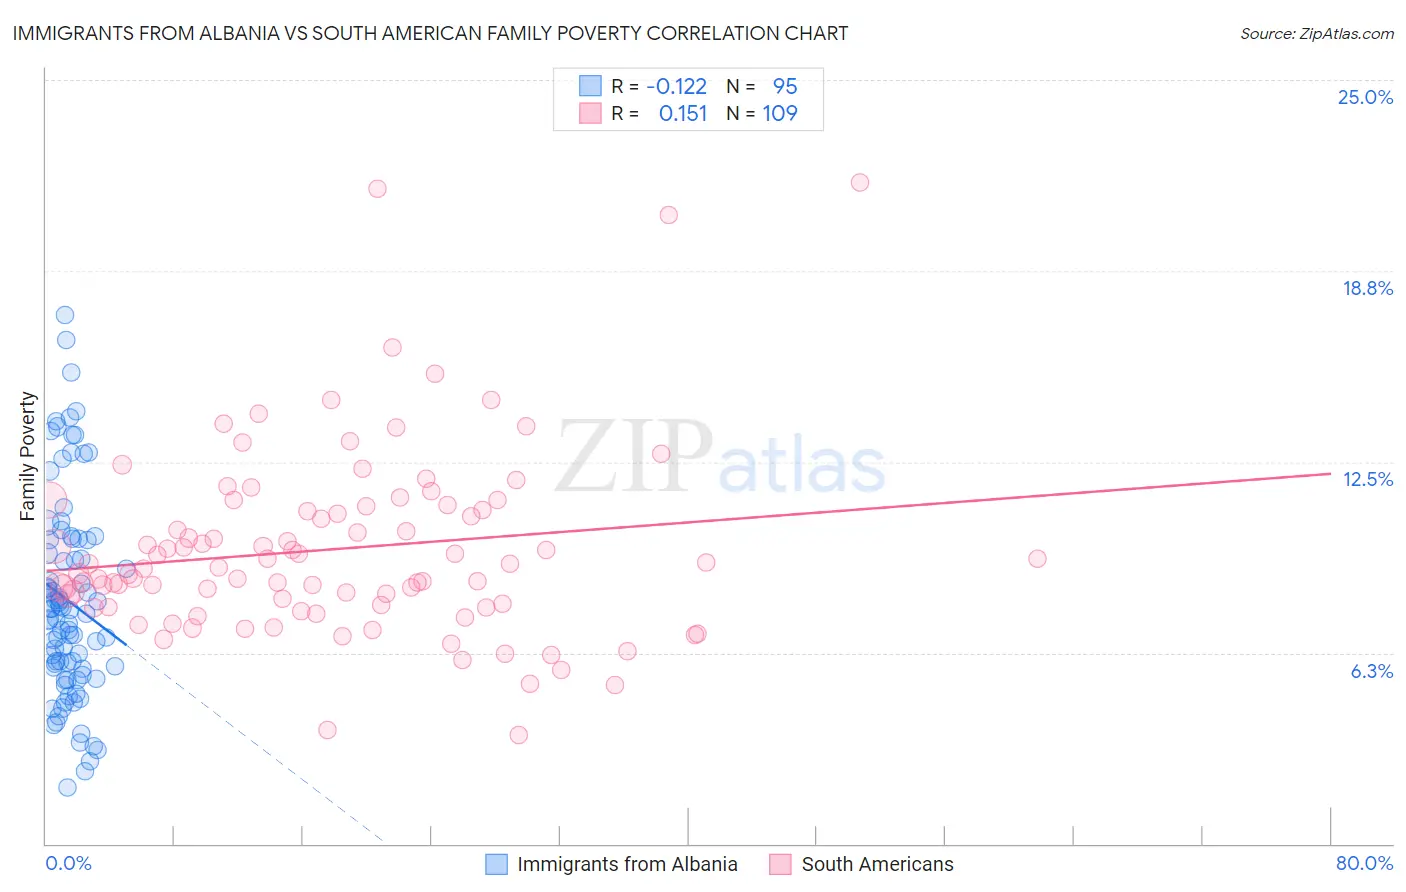
Immigrants from Albania vs South American Family Poverty Correlation Chart
The statistical analysis conducted on geographies consisting of 119,258,186 people shows a poor negative correlation between the proportion of Immigrants from Albania and poverty level among families in the United States with a correlation coefficient (R) of -0.122 and weighted average of 9.0%. Similarly, the statistical analysis conducted on geographies consisting of 491,953,900 people shows a poor positive correlation between the proportion of South Americans and poverty level among families in the United States with a correlation coefficient (R) of 0.151 and weighted average of 9.3%, a difference of 3.1%.
Family Poverty Correlation Summary
| Measurement | Immigrants from Albania | South American |
| Minimum | 1.8% | 3.6% |
| Maximum | 17.3% | 21.7% |
| Range | 15.5% | 18.1% |
| Mean | 7.9% | 9.6% |
| Median | 7.5% | 9.0% |
| Interquartile 25% (IQ1) | 5.7% | 7.8% |
| Interquartile 75% (IQ3) | 10.0% | 11.0% |
| Interquartile Range (IQR) | 4.2% | 3.2% |
| Standard Deviation (Sample) | 3.3% | 3.1% |
| Standard Deviation (Population) | 3.3% | 3.1% |
Demographics Similar to Immigrants from Albania and South Americans by Family Poverty
In terms of family poverty, the demographic groups most similar to Immigrants from Albania are Costa Rican (9.0%, a difference of 0.090%), Immigrants from Syria (9.0%, a difference of 0.33%), Hawaiian (9.0%, a difference of 0.36%), Immigrants from Cameroon (9.0%, a difference of 0.37%), and Immigrants from Iraq (9.1%, a difference of 0.74%). Similarly, the demographic groups most similar to South Americans are Immigrants from Western Asia (9.3%, a difference of 0.020%), Spanish (9.3%, a difference of 0.090%), Ugandan (9.3%, a difference of 0.10%), Arab (9.2%, a difference of 0.52%), and Immigrants from Afghanistan (9.2%, a difference of 0.60%).
| Demographics | Rating | Rank | Family Poverty |
| Immigrants | Albania | 50.0 /100 | #174 | Average 9.0% |
| Costa Ricans | 49.3 /100 | #175 | Average 9.0% |
| Immigrants | Syria | 47.5 /100 | #176 | Average 9.0% |
| Hawaiians | 47.2 /100 | #177 | Average 9.0% |
| Immigrants | Cameroon | 47.1 /100 | #178 | Average 9.0% |
| Immigrants | Iraq | 44.4 /100 | #179 | Average 9.1% |
| Immigrants | Uganda | 43.4 /100 | #180 | Average 9.1% |
| Hmong | 40.2 /100 | #181 | Average 9.1% |
| Immigrants | Morocco | 40.2 /100 | #182 | Average 9.1% |
| Uruguayans | 39.2 /100 | #183 | Fair 9.1% |
| South American Indians | 38.7 /100 | #184 | Fair 9.1% |
| Immigrants | Saudi Arabia | 38.6 /100 | #185 | Fair 9.1% |
| Colombians | 36.1 /100 | #186 | Fair 9.2% |
| Delaware | 35.4 /100 | #187 | Fair 9.2% |
| Immigrants | Kenya | 34.0 /100 | #188 | Fair 9.2% |
| Immigrants | Afghanistan | 32.1 /100 | #189 | Fair 9.2% |
| Arabs | 31.5 /100 | #190 | Fair 9.2% |
| Ugandans | 28.7 /100 | #191 | Fair 9.3% |
| Spanish | 28.7 /100 | #192 | Fair 9.3% |
| Immigrants | Western Asia | 28.2 /100 | #193 | Fair 9.3% |
| South Americans | 28.1 /100 | #194 | Fair 9.3% |