Immigrants from South America vs Cheyenne Family Poverty
COMPARE
Immigrants from South America
Cheyenne
Family Poverty
Family Poverty Comparison
Immigrants from South America
Cheyenne
9.5%
FAMILY POVERTY
18.0/ 100
METRIC RATING
206th/ 347
METRIC RANK
14.3%
FAMILY POVERTY
0.0/ 100
METRIC RATING
331st/ 347
METRIC RANK
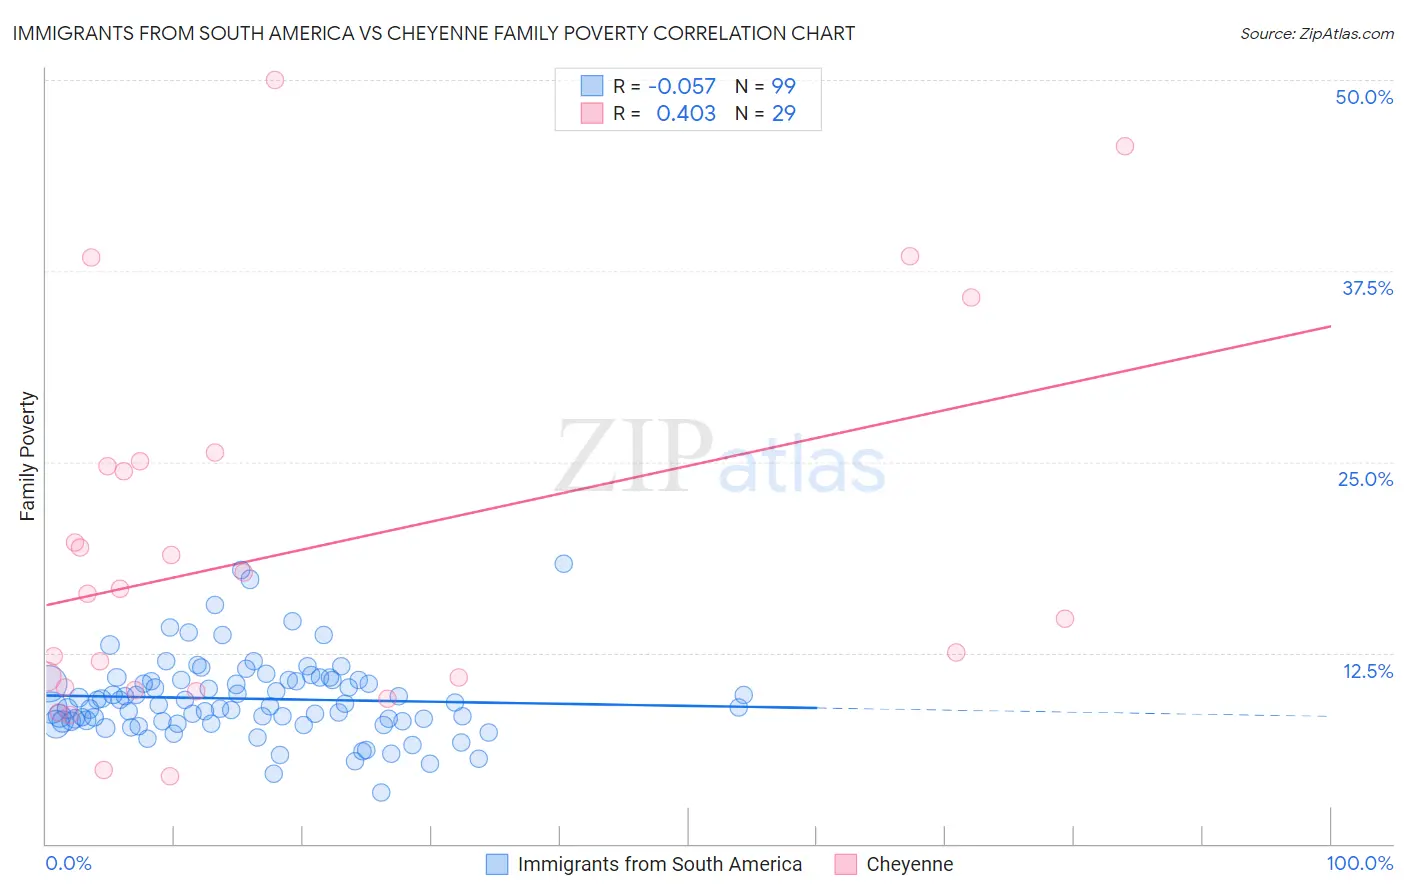
Immigrants from South America vs Cheyenne Family Poverty Correlation Chart
The statistical analysis conducted on geographies consisting of 484,267,691 people shows a slight negative correlation between the proportion of Immigrants from South America and poverty level among families in the United States with a correlation coefficient (R) of -0.057 and weighted average of 9.5%. Similarly, the statistical analysis conducted on geographies consisting of 80,652,371 people shows a moderate positive correlation between the proportion of Cheyenne and poverty level among families in the United States with a correlation coefficient (R) of 0.403 and weighted average of 14.3%, a difference of 51.1%.
Family Poverty Correlation Summary
| Measurement | Immigrants from South America | Cheyenne |
| Minimum | 3.3% | 4.4% |
| Maximum | 18.4% | 50.0% |
| Range | 15.1% | 45.6% |
| Mean | 9.5% | 19.2% |
| Median | 9.1% | 16.4% |
| Interquartile 25% (IQ1) | 8.0% | 10.1% |
| Interquartile 75% (IQ3) | 10.7% | 24.9% |
| Interquartile Range (IQR) | 2.7% | 14.7% |
| Standard Deviation (Sample) | 2.6% | 12.1% |
| Standard Deviation (Population) | 2.6% | 11.9% |
Similar Demographics by Family Poverty
Demographics Similar to Immigrants from South America by Family Poverty
In terms of family poverty, the demographic groups most similar to Immigrants from South America are Aleut (9.5%, a difference of 0.010%), Immigrants from Lebanon (9.4%, a difference of 0.20%), German Russian (9.4%, a difference of 0.30%), Immigrants from Sierra Leone (9.4%, a difference of 0.34%), and Immigrants from Portugal (9.4%, a difference of 0.52%).
| Demographics | Rating | Rank | Family Poverty |
| Spaniards | 22.8 /100 | #199 | Fair 9.4% |
| Immigrants | Costa Rica | 21.7 /100 | #200 | Fair 9.4% |
| Immigrants | Portugal | 20.5 /100 | #201 | Fair 9.4% |
| Immigrants | Sierra Leone | 19.6 /100 | #202 | Poor 9.4% |
| German Russians | 19.4 /100 | #203 | Poor 9.4% |
| Immigrants | Lebanon | 18.9 /100 | #204 | Poor 9.4% |
| Aleuts | 18.0 /100 | #205 | Poor 9.5% |
| Immigrants | South America | 18.0 /100 | #206 | Poor 9.5% |
| Sierra Leoneans | 15.6 /100 | #207 | Poor 9.5% |
| Immigrants | Eastern Africa | 15.1 /100 | #208 | Poor 9.5% |
| Immigrants | Uruguay | 14.0 /100 | #209 | Poor 9.5% |
| Alsatians | 11.3 /100 | #210 | Poor 9.6% |
| Malaysians | 10.6 /100 | #211 | Poor 9.6% |
| Immigrants | Thailand | 9.7 /100 | #212 | Tragic 9.7% |
| Osage | 8.0 /100 | #213 | Tragic 9.7% |
Demographics Similar to Cheyenne by Family Poverty
In terms of family poverty, the demographic groups most similar to Cheyenne are Native/Alaskan (14.3%, a difference of 0.14%), Dominican (14.3%, a difference of 0.44%), Immigrants from Dominican Republic (14.4%, a difference of 1.1%), Houma (14.6%, a difference of 2.4%), and Apache (14.7%, a difference of 3.2%).
| Demographics | Rating | Rank | Family Poverty |
| Immigrants | Dominica | 0.0 /100 | #324 | Tragic 12.7% |
| Paiute | 0.0 /100 | #325 | Tragic 13.0% |
| Colville | 0.0 /100 | #326 | Tragic 13.0% |
| Yakama | 0.0 /100 | #327 | Tragic 13.1% |
| Central American Indians | 0.0 /100 | #328 | Tragic 13.3% |
| Blacks/African Americans | 0.0 /100 | #329 | Tragic 13.3% |
| Natives/Alaskans | 0.0 /100 | #330 | Tragic 14.3% |
| Cheyenne | 0.0 /100 | #331 | Tragic 14.3% |
| Dominicans | 0.0 /100 | #332 | Tragic 14.3% |
| Immigrants | Dominican Republic | 0.0 /100 | #333 | Tragic 14.4% |
| Houma | 0.0 /100 | #334 | Tragic 14.6% |
| Apache | 0.0 /100 | #335 | Tragic 14.7% |
| Sioux | 0.0 /100 | #336 | Tragic 15.9% |
| Hopi | 0.0 /100 | #337 | Tragic 15.9% |
| Crow | 0.0 /100 | #338 | Tragic 16.1% |