Immigrants from Afghanistan vs Czechoslovakian Child Poverty Among Girls Under 16
COMPARE
Immigrants from Afghanistan
Czechoslovakian
Child Poverty Among Girls Under 16
Child Poverty Among Girls Under 16 Comparison
Immigrants from Afghanistan
Czechoslovakians
17.1%
CHILD POVERTY AMONG GIRLS UNDER 16
22.4/ 100
METRIC RATING
199th/ 347
METRIC RANK
15.5%
CHILD POVERTY AMONG GIRLS UNDER 16
89.0/ 100
METRIC RATING
135th/ 347
METRIC RANK
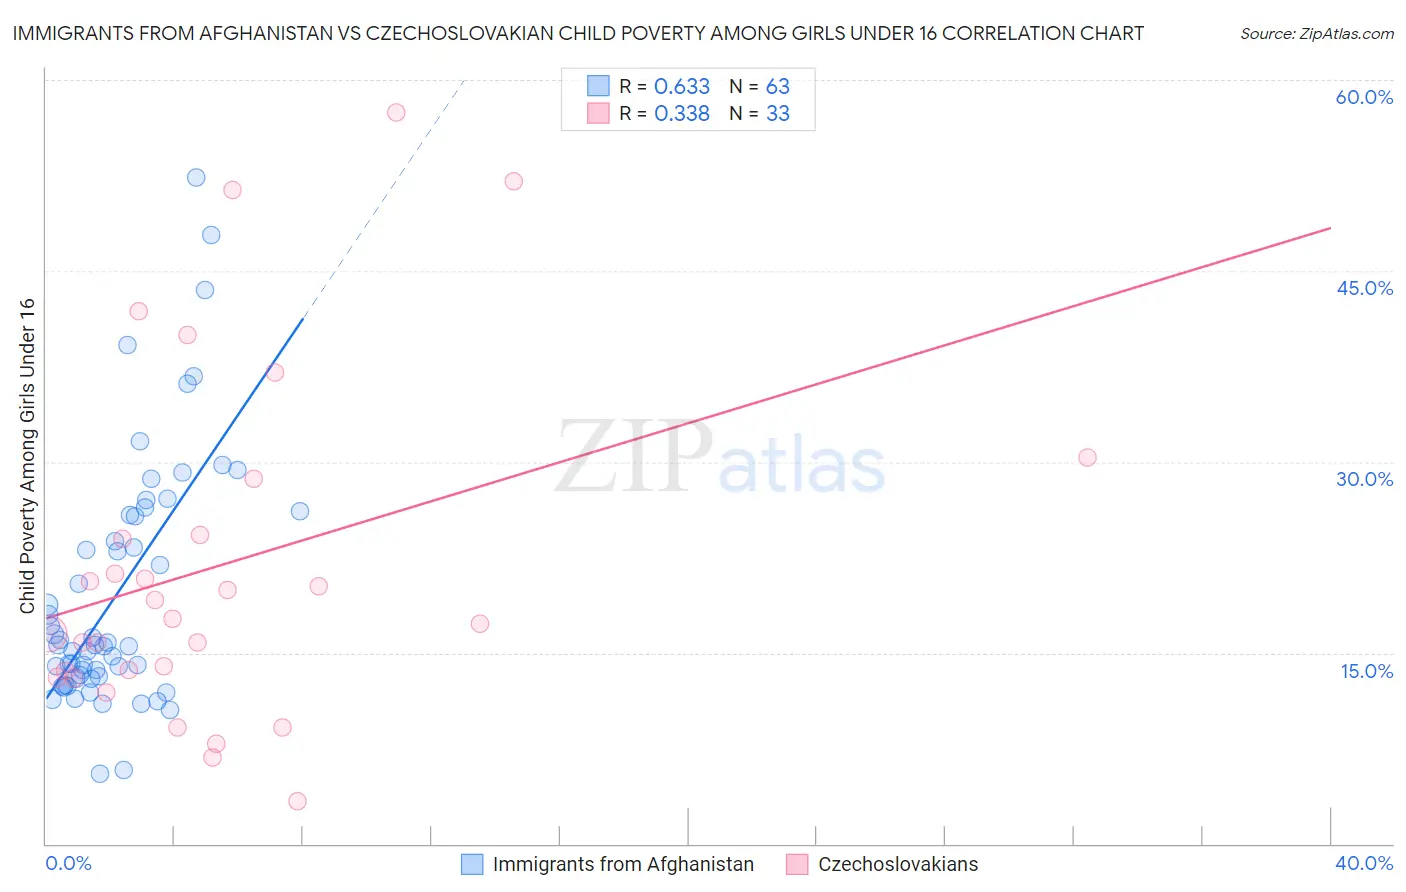
Immigrants from Afghanistan vs Czechoslovakian Child Poverty Among Girls Under 16 Correlation Chart
The statistical analysis conducted on geographies consisting of 146,743,598 people shows a significant positive correlation between the proportion of Immigrants from Afghanistan and poverty level among girls under the age of 16 in the United States with a correlation coefficient (R) of 0.633 and weighted average of 17.1%. Similarly, the statistical analysis conducted on geographies consisting of 361,103,905 people shows a mild positive correlation between the proportion of Czechoslovakians and poverty level among girls under the age of 16 in the United States with a correlation coefficient (R) of 0.338 and weighted average of 15.5%, a difference of 10.2%.
Child Poverty Among Girls Under 16 Correlation Summary
| Measurement | Immigrants from Afghanistan | Czechoslovakian |
| Minimum | 5.5% | 3.3% |
| Maximum | 52.3% | 57.5% |
| Range | 46.8% | 54.2% |
| Mean | 19.7% | 21.9% |
| Median | 15.6% | 17.6% |
| Interquartile 25% (IQ1) | 13.0% | 13.3% |
| Interquartile 75% (IQ3) | 25.8% | 26.5% |
| Interquartile Range (IQR) | 12.8% | 13.1% |
| Standard Deviation (Sample) | 9.8% | 13.6% |
| Standard Deviation (Population) | 9.8% | 13.4% |
Similar Demographics by Child Poverty Among Girls Under 16
Demographics Similar to Immigrants from Afghanistan by Child Poverty Among Girls Under 16
In terms of child poverty among girls under 16, the demographic groups most similar to Immigrants from Afghanistan are Immigrants from Lebanon (17.1%, a difference of 0.020%), Immigrants from Uzbekistan (17.1%, a difference of 0.16%), Spaniard (17.0%, a difference of 0.38%), Celtic (17.0%, a difference of 0.43%), and Immigrants from Costa Rica (17.0%, a difference of 0.48%).
| Demographics | Rating | Rank | Child Poverty Among Girls Under 16 |
| Immigrants | Uganda | 31.3 /100 | #192 | Fair 16.8% |
| Aleuts | 28.7 /100 | #193 | Fair 16.9% |
| Spanish | 28.6 /100 | #194 | Fair 16.9% |
| Immigrants | Costa Rica | 25.6 /100 | #195 | Fair 17.0% |
| Celtics | 25.2 /100 | #196 | Fair 17.0% |
| Spaniards | 24.9 /100 | #197 | Fair 17.0% |
| Immigrants | Lebanon | 22.6 /100 | #198 | Fair 17.1% |
| Immigrants | Afghanistan | 22.4 /100 | #199 | Fair 17.1% |
| Immigrants | Uzbekistan | 21.5 /100 | #200 | Fair 17.1% |
| Immigrants | Kenya | 17.8 /100 | #201 | Poor 17.2% |
| Immigrants | Sierra Leone | 17.6 /100 | #202 | Poor 17.2% |
| Ugandans | 17.5 /100 | #203 | Poor 17.2% |
| Iraqis | 13.0 /100 | #204 | Poor 17.4% |
| Immigrants | Cameroon | 12.6 /100 | #205 | Poor 17.4% |
| Delaware | 11.5 /100 | #206 | Poor 17.4% |
Demographics Similar to Czechoslovakians by Child Poverty Among Girls Under 16
In terms of child poverty among girls under 16, the demographic groups most similar to Czechoslovakians are Native Hawaiian (15.5%, a difference of 0.020%), Immigrants from Spain (15.5%, a difference of 0.030%), South African (15.5%, a difference of 0.11%), Brazilian (15.4%, a difference of 0.19%), and Mongolian (15.4%, a difference of 0.21%).
| Demographics | Rating | Rank | Child Poverty Among Girls Under 16 |
| Albanians | 90.5 /100 | #128 | Exceptional 15.4% |
| Immigrants | South Eastern Asia | 90.5 /100 | #129 | Exceptional 15.4% |
| Puget Sound Salish | 90.1 /100 | #130 | Exceptional 15.4% |
| Immigrants | Western Europe | 90.0 /100 | #131 | Exceptional 15.4% |
| Mongolians | 89.7 /100 | #132 | Excellent 15.4% |
| Brazilians | 89.6 /100 | #133 | Excellent 15.4% |
| Immigrants | Spain | 89.1 /100 | #134 | Excellent 15.5% |
| Czechoslovakians | 89.0 /100 | #135 | Excellent 15.5% |
| Native Hawaiians | 89.0 /100 | #136 | Excellent 15.5% |
| South Africans | 88.7 /100 | #137 | Excellent 15.5% |
| Immigrants | Vietnam | 88.2 /100 | #138 | Excellent 15.5% |
| Armenians | 87.9 /100 | #139 | Excellent 15.5% |
| New Zealanders | 87.2 /100 | #140 | Excellent 15.6% |
| Immigrants | Jordan | 87.2 /100 | #141 | Excellent 15.6% |
| Canadians | 87.1 /100 | #142 | Excellent 15.6% |