Immigrants from Afghanistan vs Immigrants from Belgium Child Poverty Among Girls Under 16
COMPARE
Immigrants from Afghanistan
Immigrants from Belgium
Child Poverty Among Girls Under 16
Child Poverty Among Girls Under 16 Comparison
Immigrants from Afghanistan
Immigrants from Belgium
17.1%
CHILD POVERTY AMONG GIRLS UNDER 16
22.4/ 100
METRIC RATING
199th/ 347
METRIC RANK
14.5%
CHILD POVERTY AMONG GIRLS UNDER 16
98.5/ 100
METRIC RATING
66th/ 347
METRIC RANK
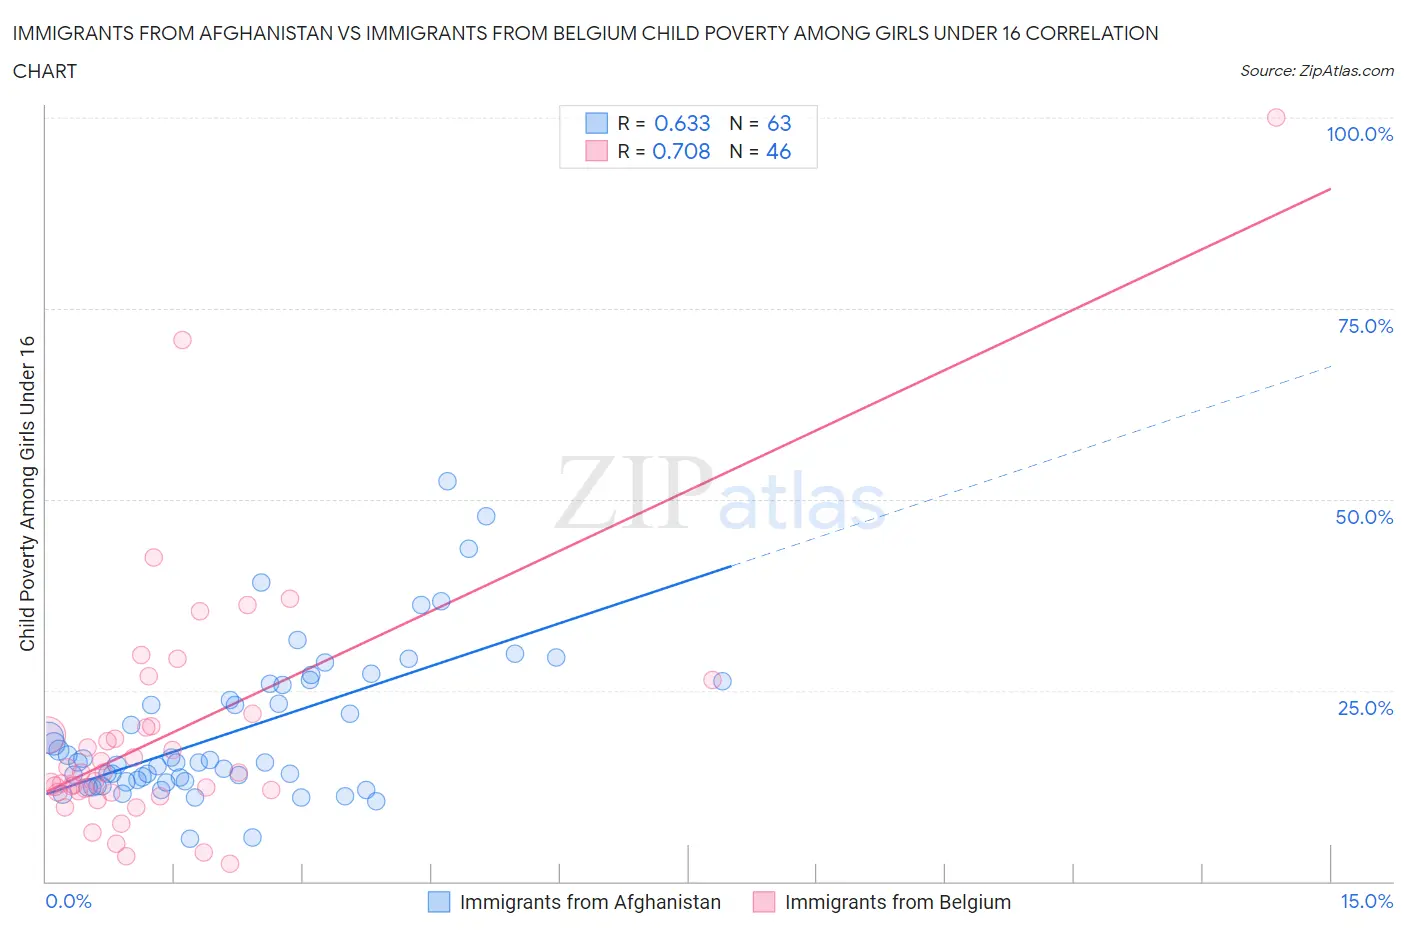
Immigrants from Afghanistan vs Immigrants from Belgium Child Poverty Among Girls Under 16 Correlation Chart
The statistical analysis conducted on geographies consisting of 146,743,598 people shows a significant positive correlation between the proportion of Immigrants from Afghanistan and poverty level among girls under the age of 16 in the United States with a correlation coefficient (R) of 0.633 and weighted average of 17.1%. Similarly, the statistical analysis conducted on geographies consisting of 145,025,757 people shows a strong positive correlation between the proportion of Immigrants from Belgium and poverty level among girls under the age of 16 in the United States with a correlation coefficient (R) of 0.708 and weighted average of 14.5%, a difference of 17.8%.
Child Poverty Among Girls Under 16 Correlation Summary
| Measurement | Immigrants from Afghanistan | Immigrants from Belgium |
| Minimum | 5.5% | 2.3% |
| Maximum | 52.3% | 100.0% |
| Range | 46.8% | 97.7% |
| Mean | 19.7% | 19.4% |
| Median | 15.6% | 14.3% |
| Interquartile 25% (IQ1) | 13.0% | 11.6% |
| Interquartile 75% (IQ3) | 25.8% | 20.4% |
| Interquartile Range (IQR) | 12.8% | 8.8% |
| Standard Deviation (Sample) | 9.8% | 17.1% |
| Standard Deviation (Population) | 9.8% | 17.0% |
Similar Demographics by Child Poverty Among Girls Under 16
Demographics Similar to Immigrants from Afghanistan by Child Poverty Among Girls Under 16
In terms of child poverty among girls under 16, the demographic groups most similar to Immigrants from Afghanistan are Immigrants from Lebanon (17.1%, a difference of 0.020%), Immigrants from Uzbekistan (17.1%, a difference of 0.16%), Spaniard (17.0%, a difference of 0.38%), Celtic (17.0%, a difference of 0.43%), and Immigrants from Costa Rica (17.0%, a difference of 0.48%).
| Demographics | Rating | Rank | Child Poverty Among Girls Under 16 |
| Immigrants | Uganda | 31.3 /100 | #192 | Fair 16.8% |
| Aleuts | 28.7 /100 | #193 | Fair 16.9% |
| Spanish | 28.6 /100 | #194 | Fair 16.9% |
| Immigrants | Costa Rica | 25.6 /100 | #195 | Fair 17.0% |
| Celtics | 25.2 /100 | #196 | Fair 17.0% |
| Spaniards | 24.9 /100 | #197 | Fair 17.0% |
| Immigrants | Lebanon | 22.6 /100 | #198 | Fair 17.1% |
| Immigrants | Afghanistan | 22.4 /100 | #199 | Fair 17.1% |
| Immigrants | Uzbekistan | 21.5 /100 | #200 | Fair 17.1% |
| Immigrants | Kenya | 17.8 /100 | #201 | Poor 17.2% |
| Immigrants | Sierra Leone | 17.6 /100 | #202 | Poor 17.2% |
| Ugandans | 17.5 /100 | #203 | Poor 17.2% |
| Iraqis | 13.0 /100 | #204 | Poor 17.4% |
| Immigrants | Cameroon | 12.6 /100 | #205 | Poor 17.4% |
| Delaware | 11.5 /100 | #206 | Poor 17.4% |
Demographics Similar to Immigrants from Belgium by Child Poverty Among Girls Under 16
In terms of child poverty among girls under 16, the demographic groups most similar to Immigrants from Belgium are Immigrants from Sweden (14.5%, a difference of 0.16%), Immigrants from Philippines (14.4%, a difference of 0.19%), Immigrants from Europe (14.4%, a difference of 0.30%), Scandinavian (14.4%, a difference of 0.35%), and Laotian (14.5%, a difference of 0.41%).
| Demographics | Rating | Rank | Child Poverty Among Girls Under 16 |
| Zimbabweans | 98.8 /100 | #59 | Exceptional 14.4% |
| Poles | 98.7 /100 | #60 | Exceptional 14.4% |
| Cambodians | 98.7 /100 | #61 | Exceptional 14.4% |
| Scandinavians | 98.7 /100 | #62 | Exceptional 14.4% |
| Immigrants | Europe | 98.7 /100 | #63 | Exceptional 14.4% |
| Immigrants | Philippines | 98.6 /100 | #64 | Exceptional 14.4% |
| Immigrants | Sweden | 98.6 /100 | #65 | Exceptional 14.5% |
| Immigrants | Belgium | 98.5 /100 | #66 | Exceptional 14.5% |
| Laotians | 98.4 /100 | #67 | Exceptional 14.5% |
| Immigrants | Argentina | 98.3 /100 | #68 | Exceptional 14.6% |
| Immigrants | Poland | 98.2 /100 | #69 | Exceptional 14.6% |
| Europeans | 98.1 /100 | #70 | Exceptional 14.6% |
| Slovenes | 98.1 /100 | #71 | Exceptional 14.6% |
| Immigrants | Netherlands | 98.1 /100 | #72 | Exceptional 14.6% |
| Immigrants | Austria | 98.0 /100 | #73 | Exceptional 14.6% |