Icelander vs Pennsylvania German Seniors Poverty Over the Age of 75
COMPARE
Icelander
Pennsylvania German
Seniors Poverty Over the Age of 75
Seniors Poverty Over the Age of 75 Comparison
Icelanders
Pennsylvania Germans
11.7%
SENIORS POVERTY OVER THE AGE OF 75
85.7/ 100
METRIC RATING
117th/ 347
METRIC RANK
11.8%
SENIORS POVERTY OVER THE AGE OF 75
83.4/ 100
METRIC RATING
126th/ 347
METRIC RANK
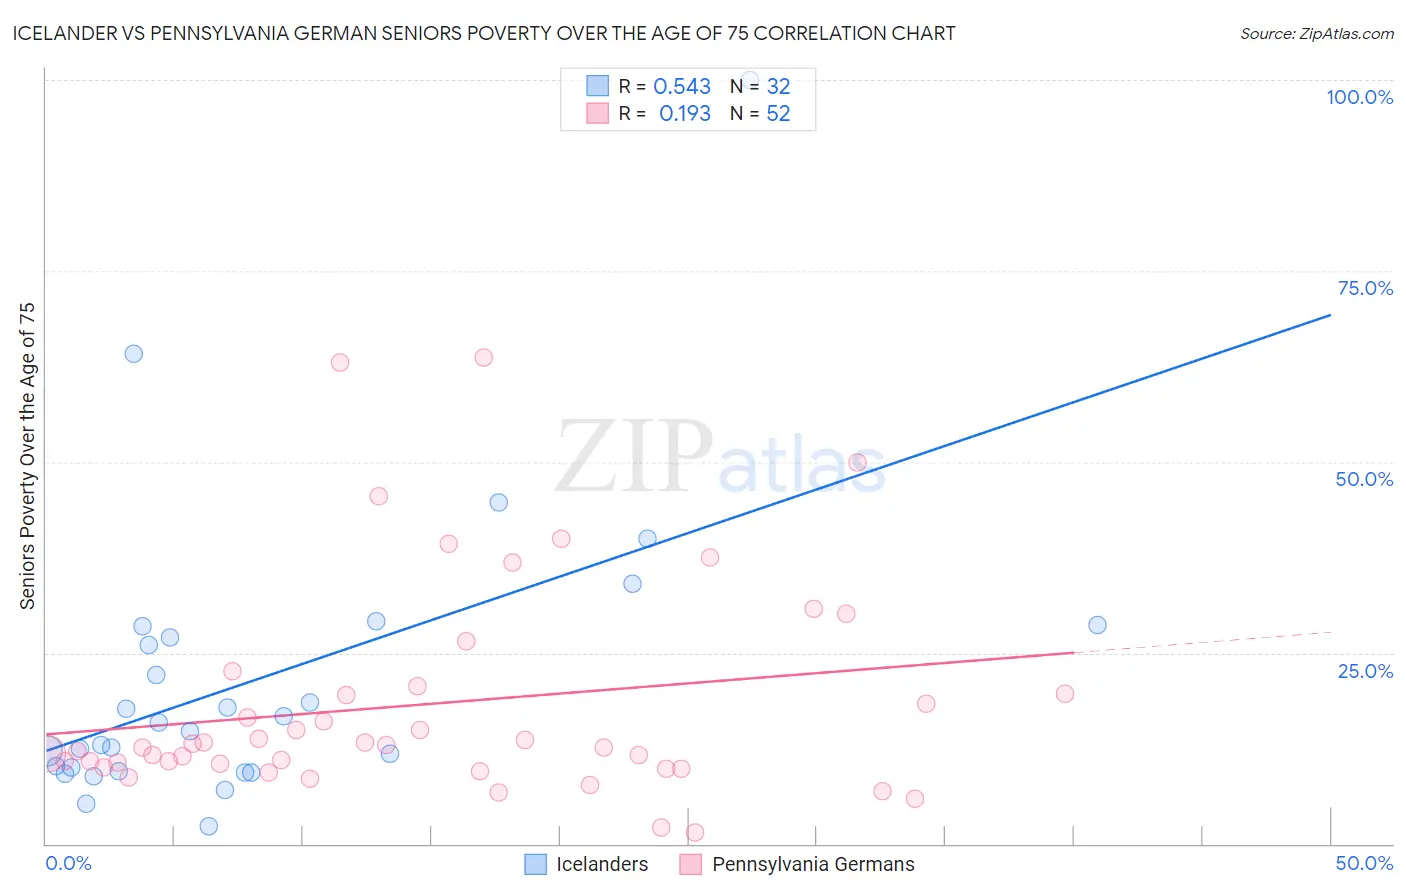
Icelander vs Pennsylvania German Seniors Poverty Over the Age of 75 Correlation Chart
The statistical analysis conducted on geographies consisting of 158,818,038 people shows a substantial positive correlation between the proportion of Icelanders and poverty level among seniors over the age of 75 in the United States with a correlation coefficient (R) of 0.543 and weighted average of 11.7%. Similarly, the statistical analysis conducted on geographies consisting of 232,114,094 people shows a poor positive correlation between the proportion of Pennsylvania Germans and poverty level among seniors over the age of 75 in the United States with a correlation coefficient (R) of 0.193 and weighted average of 11.8%, a difference of 0.38%.
Seniors Poverty Over the Age of 75 Correlation Summary
| Measurement | Icelander | Pennsylvania German |
| Minimum | 2.3% | 1.5% |
| Maximum | 100.0% | 63.6% |
| Range | 97.7% | 62.2% |
| Mean | 21.5% | 18.3% |
| Median | 15.3% | 12.7% |
| Interquartile 25% (IQ1) | 9.7% | 10.2% |
| Interquartile 75% (IQ3) | 27.7% | 20.2% |
| Interquartile Range (IQR) | 18.0% | 9.9% |
| Standard Deviation (Sample) | 19.4% | 14.2% |
| Standard Deviation (Population) | 19.1% | 14.0% |
Demographics Similar to Icelanders and Pennsylvania Germans by Seniors Poverty Over the Age of 75
In terms of seniors poverty over the age of 75, the demographic groups most similar to Icelanders are Immigrants from Zimbabwe (11.7%, a difference of 0.030%), New Zealander (11.7%, a difference of 0.11%), Iraqi (11.7%, a difference of 0.11%), Immigrants from Uganda (11.8%, a difference of 0.16%), and Immigrants from Nepal (11.8%, a difference of 0.20%). Similarly, the demographic groups most similar to Pennsylvania Germans are Sudanese (11.8%, a difference of 0.040%), Fijian (11.8%, a difference of 0.060%), Immigrants from Italy (11.8%, a difference of 0.090%), Pakistani (11.8%, a difference of 0.10%), and Malaysian (11.8%, a difference of 0.11%).
| Demographics | Rating | Rank | Seniors Poverty Over the Age of 75 |
| Burmese | 88.7 /100 | #111 | Excellent 11.7% |
| Immigrants | Bolivia | 88.4 /100 | #112 | Excellent 11.7% |
| Immigrants | Czechoslovakia | 87.0 /100 | #113 | Excellent 11.7% |
| Ukrainians | 86.9 /100 | #114 | Excellent 11.7% |
| New Zealanders | 86.3 /100 | #115 | Excellent 11.7% |
| Iraqis | 86.3 /100 | #116 | Excellent 11.7% |
| Icelanders | 85.7 /100 | #117 | Excellent 11.7% |
| Immigrants | Zimbabwe | 85.5 /100 | #118 | Excellent 11.7% |
| Immigrants | Uganda | 84.8 /100 | #119 | Excellent 11.8% |
| Immigrants | Nepal | 84.5 /100 | #120 | Excellent 11.8% |
| Malaysians | 84.1 /100 | #121 | Excellent 11.8% |
| Pakistanis | 84.0 /100 | #122 | Excellent 11.8% |
| Immigrants | Italy | 84.0 /100 | #123 | Excellent 11.8% |
| Fijians | 83.8 /100 | #124 | Excellent 11.8% |
| Sudanese | 83.6 /100 | #125 | Excellent 11.8% |
| Pennsylvania Germans | 83.4 /100 | #126 | Excellent 11.8% |
| Immigrants | Denmark | 82.6 /100 | #127 | Excellent 11.8% |
| Immigrants | Hungary | 81.7 /100 | #128 | Excellent 11.8% |
| Ethiopians | 80.7 /100 | #129 | Excellent 11.8% |
| Spanish | 80.5 /100 | #130 | Excellent 11.8% |
| Immigrants | Western Europe | 79.6 /100 | #131 | Good 11.9% |