Icelander vs Immigrants from Japan Seniors Poverty Over the Age of 75
COMPARE
Icelander
Immigrants from Japan
Seniors Poverty Over the Age of 75
Seniors Poverty Over the Age of 75 Comparison
Icelanders
Immigrants from Japan
11.7%
SENIORS POVERTY OVER THE AGE OF 75
85.7/ 100
METRIC RATING
117th/ 347
METRIC RANK
11.6%
SENIORS POVERTY OVER THE AGE OF 75
91.9/ 100
METRIC RATING
98th/ 347
METRIC RANK
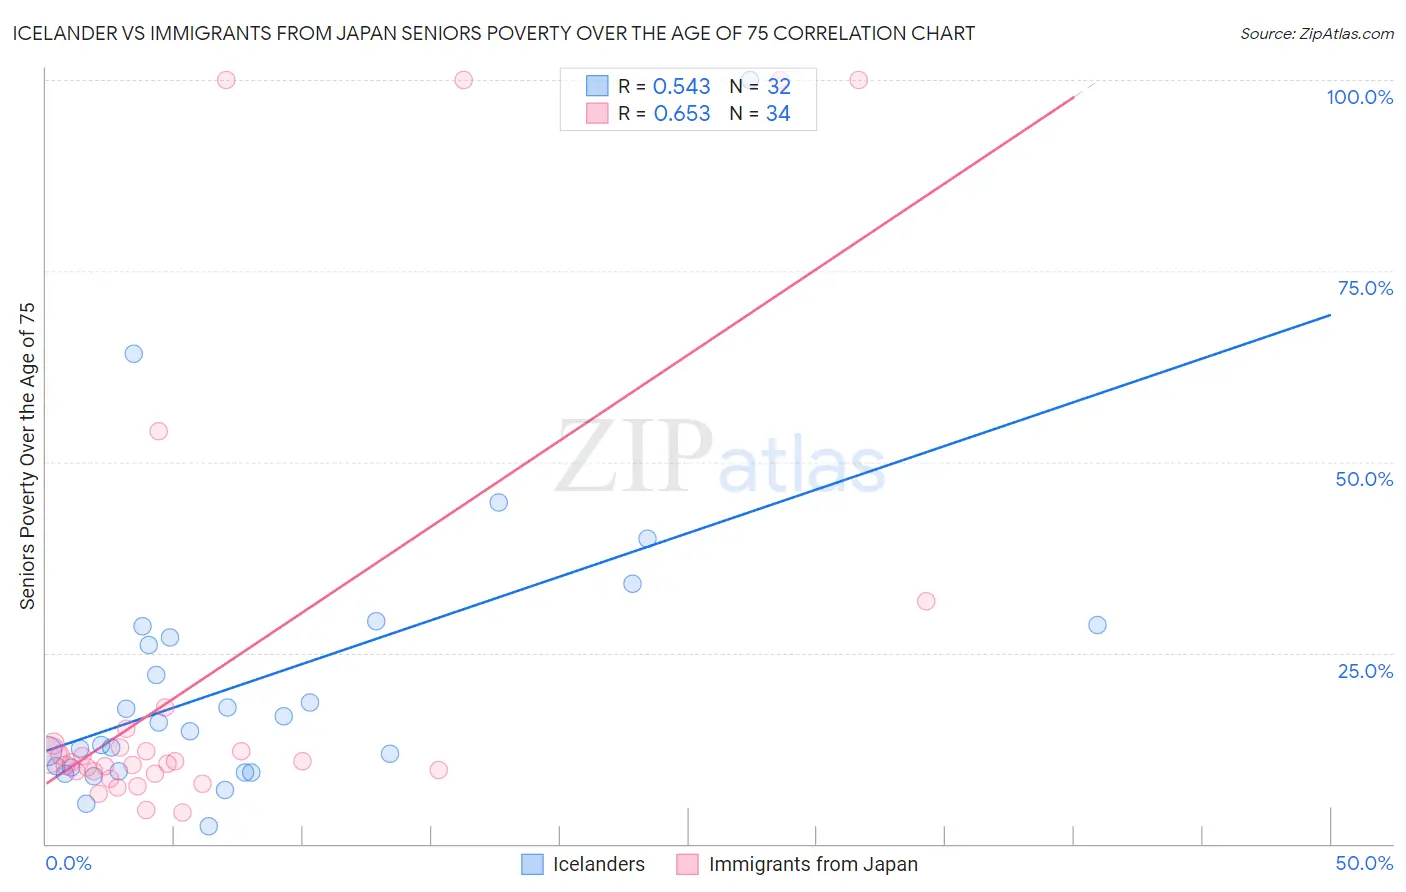
Icelander vs Immigrants from Japan Seniors Poverty Over the Age of 75 Correlation Chart
The statistical analysis conducted on geographies consisting of 158,818,038 people shows a substantial positive correlation between the proportion of Icelanders and poverty level among seniors over the age of 75 in the United States with a correlation coefficient (R) of 0.543 and weighted average of 11.7%. Similarly, the statistical analysis conducted on geographies consisting of 336,933,586 people shows a significant positive correlation between the proportion of Immigrants from Japan and poverty level among seniors over the age of 75 in the United States with a correlation coefficient (R) of 0.653 and weighted average of 11.6%, a difference of 1.4%.
Seniors Poverty Over the Age of 75 Correlation Summary
| Measurement | Icelander | Immigrants from Japan |
| Minimum | 2.3% | 4.0% |
| Maximum | 100.0% | 100.0% |
| Range | 97.7% | 96.0% |
| Mean | 21.5% | 22.7% |
| Median | 15.3% | 10.7% |
| Interquartile 25% (IQ1) | 9.7% | 9.4% |
| Interquartile 75% (IQ3) | 27.7% | 13.1% |
| Interquartile Range (IQR) | 18.0% | 3.7% |
| Standard Deviation (Sample) | 19.4% | 29.9% |
| Standard Deviation (Population) | 19.1% | 29.5% |
Demographics Similar to Icelanders and Immigrants from Japan by Seniors Poverty Over the Age of 75
In terms of seniors poverty over the age of 75, the demographic groups most similar to Icelanders are New Zealander (11.7%, a difference of 0.11%), Iraqi (11.7%, a difference of 0.11%), Ukrainian (11.7%, a difference of 0.21%), Immigrants from Czechoslovakia (11.7%, a difference of 0.22%), and Immigrants from Bolivia (11.7%, a difference of 0.50%). Similarly, the demographic groups most similar to Immigrants from Japan are Immigrants from Ethiopia (11.6%, a difference of 0.070%), Romanian (11.6%, a difference of 0.11%), Syrian (11.6%, a difference of 0.23%), Jordanian (11.6%, a difference of 0.31%), and Guamanian/Chamorro (11.6%, a difference of 0.35%).
| Demographics | Rating | Rank | Seniors Poverty Over the Age of 75 |
| Romanians | 92.3 /100 | #97 | Exceptional 11.6% |
| Immigrants | Japan | 91.9 /100 | #98 | Exceptional 11.6% |
| Immigrants | Ethiopia | 91.7 /100 | #99 | Exceptional 11.6% |
| Syrians | 91.1 /100 | #100 | Exceptional 11.6% |
| Jordanians | 90.8 /100 | #101 | Exceptional 11.6% |
| Guamanians/Chamorros | 90.6 /100 | #102 | Exceptional 11.6% |
| Immigrants | Kuwait | 90.5 /100 | #103 | Exceptional 11.6% |
| Immigrants | Singapore | 90.3 /100 | #104 | Exceptional 11.6% |
| Chickasaw | 90.2 /100 | #105 | Exceptional 11.6% |
| Russians | 89.9 /100 | #106 | Excellent 11.6% |
| Immigrants | Oceania | 89.4 /100 | #107 | Excellent 11.7% |
| Turks | 89.4 /100 | #108 | Excellent 11.7% |
| South Africans | 89.3 /100 | #109 | Excellent 11.7% |
| Immigrants | Jordan | 88.7 /100 | #110 | Excellent 11.7% |
| Burmese | 88.7 /100 | #111 | Excellent 11.7% |
| Immigrants | Bolivia | 88.4 /100 | #112 | Excellent 11.7% |
| Immigrants | Czechoslovakia | 87.0 /100 | #113 | Excellent 11.7% |
| Ukrainians | 86.9 /100 | #114 | Excellent 11.7% |
| New Zealanders | 86.3 /100 | #115 | Excellent 11.7% |
| Iraqis | 86.3 /100 | #116 | Excellent 11.7% |
| Icelanders | 85.7 /100 | #117 | Excellent 11.7% |