Immigrants from Cabo Verde vs Pennsylvania German Seniors Poverty Over the Age of 75
COMPARE
Immigrants from Cabo Verde
Pennsylvania German
Seniors Poverty Over the Age of 75
Seniors Poverty Over the Age of 75 Comparison
Immigrants from Cabo Verde
Pennsylvania Germans
18.5%
SENIORS POVERTY OVER THE AGE OF 75
0.0/ 100
METRIC RATING
338th/ 347
METRIC RANK
11.8%
SENIORS POVERTY OVER THE AGE OF 75
83.4/ 100
METRIC RATING
126th/ 347
METRIC RANK
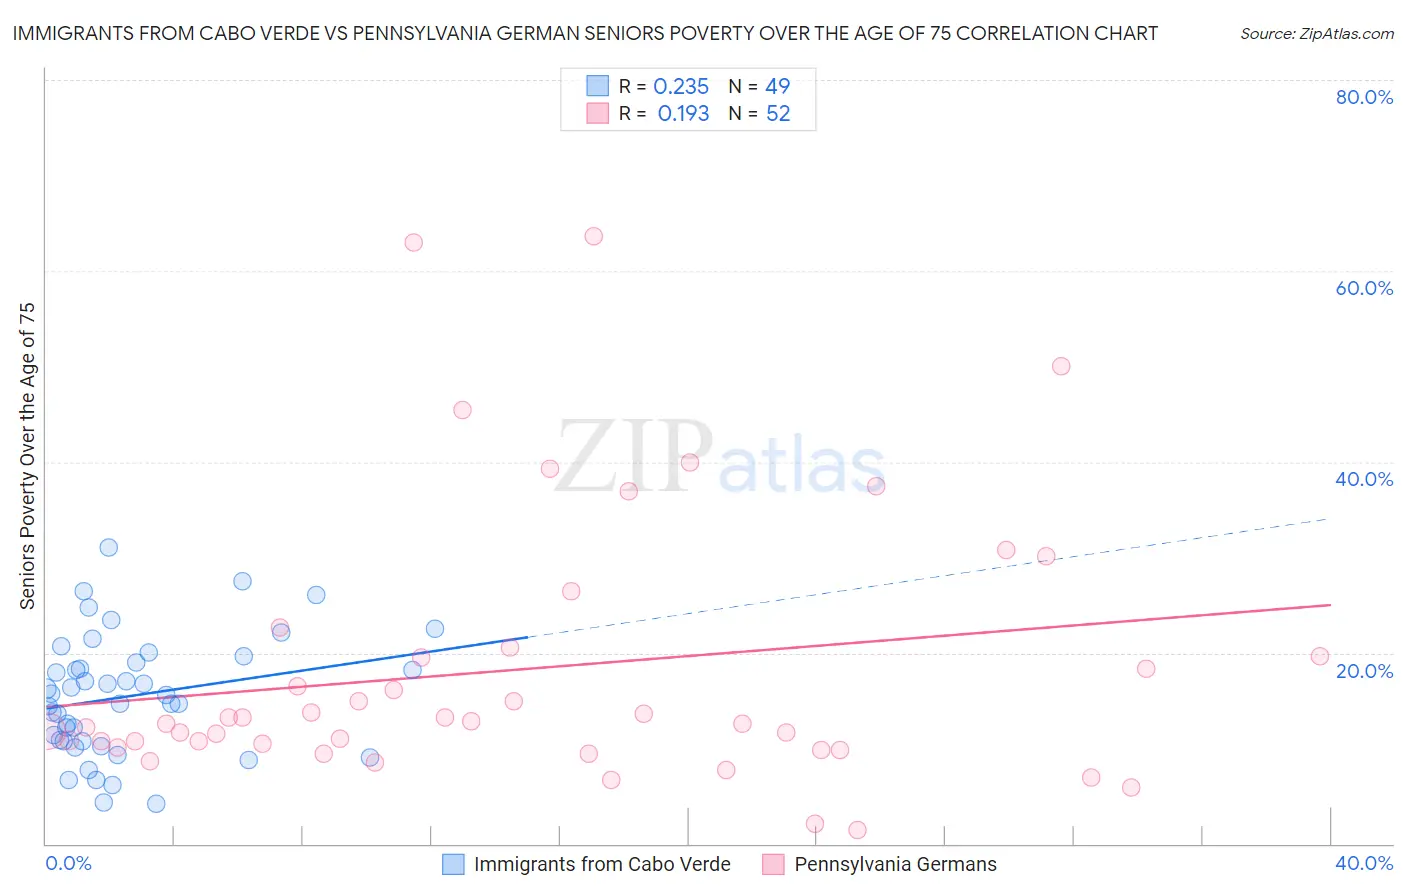
Immigrants from Cabo Verde vs Pennsylvania German Seniors Poverty Over the Age of 75 Correlation Chart
The statistical analysis conducted on geographies consisting of 37,992,764 people shows a weak positive correlation between the proportion of Immigrants from Cabo Verde and poverty level among seniors over the age of 75 in the United States with a correlation coefficient (R) of 0.235 and weighted average of 18.5%. Similarly, the statistical analysis conducted on geographies consisting of 232,114,094 people shows a poor positive correlation between the proportion of Pennsylvania Germans and poverty level among seniors over the age of 75 in the United States with a correlation coefficient (R) of 0.193 and weighted average of 11.8%, a difference of 56.9%.
Seniors Poverty Over the Age of 75 Correlation Summary
| Measurement | Immigrants from Cabo Verde | Pennsylvania German |
| Minimum | 4.3% | 1.5% |
| Maximum | 31.1% | 63.6% |
| Range | 26.8% | 62.2% |
| Mean | 15.5% | 18.3% |
| Median | 15.6% | 12.7% |
| Interquartile 25% (IQ1) | 10.8% | 10.2% |
| Interquartile 75% (IQ3) | 19.3% | 20.2% |
| Interquartile Range (IQR) | 8.6% | 9.9% |
| Standard Deviation (Sample) | 6.2% | 14.2% |
| Standard Deviation (Population) | 6.2% | 14.0% |
Similar Demographics by Seniors Poverty Over the Age of 75
Demographics Similar to Immigrants from Cabo Verde by Seniors Poverty Over the Age of 75
In terms of seniors poverty over the age of 75, the demographic groups most similar to Immigrants from Cabo Verde are Yakama (18.3%, a difference of 0.97%), Immigrants from Caribbean (18.2%, a difference of 1.4%), Hopi (18.9%, a difference of 2.0%), Cuban (18.0%, a difference of 3.0%), and Tohono O'odham (19.1%, a difference of 3.5%).
| Demographics | Rating | Rank | Seniors Poverty Over the Age of 75 |
| Immigrants | Armenia | 0.0 /100 | #331 | Tragic 17.5% |
| Immigrants | St. Vincent and the Grenadines | 0.0 /100 | #332 | Tragic 17.5% |
| Immigrants | Nicaragua | 0.0 /100 | #333 | Tragic 17.6% |
| Immigrants | Grenada | 0.0 /100 | #334 | Tragic 17.8% |
| Cubans | 0.0 /100 | #335 | Tragic 18.0% |
| Immigrants | Caribbean | 0.0 /100 | #336 | Tragic 18.2% |
| Yakama | 0.0 /100 | #337 | Tragic 18.3% |
| Immigrants | Cabo Verde | 0.0 /100 | #338 | Tragic 18.5% |
| Hopi | 0.0 /100 | #339 | Tragic 18.9% |
| Tohono O'odham | 0.0 /100 | #340 | Tragic 19.1% |
| Navajo | 0.0 /100 | #341 | Tragic 19.4% |
| Dominicans | 0.0 /100 | #342 | Tragic 19.6% |
| Lumbee | 0.0 /100 | #343 | Tragic 19.7% |
| Immigrants | Cuba | 0.0 /100 | #344 | Tragic 19.9% |
| Immigrants | Dominican Republic | 0.0 /100 | #345 | Tragic 20.1% |
Demographics Similar to Pennsylvania Germans by Seniors Poverty Over the Age of 75
In terms of seniors poverty over the age of 75, the demographic groups most similar to Pennsylvania Germans are Sudanese (11.8%, a difference of 0.040%), Fijian (11.8%, a difference of 0.060%), Immigrants from Italy (11.8%, a difference of 0.090%), Pakistani (11.8%, a difference of 0.10%), and Malaysian (11.8%, a difference of 0.11%).
| Demographics | Rating | Rank | Seniors Poverty Over the Age of 75 |
| Immigrants | Uganda | 84.8 /100 | #119 | Excellent 11.8% |
| Immigrants | Nepal | 84.5 /100 | #120 | Excellent 11.8% |
| Malaysians | 84.1 /100 | #121 | Excellent 11.8% |
| Pakistanis | 84.0 /100 | #122 | Excellent 11.8% |
| Immigrants | Italy | 84.0 /100 | #123 | Excellent 11.8% |
| Fijians | 83.8 /100 | #124 | Excellent 11.8% |
| Sudanese | 83.6 /100 | #125 | Excellent 11.8% |
| Pennsylvania Germans | 83.4 /100 | #126 | Excellent 11.8% |
| Immigrants | Denmark | 82.6 /100 | #127 | Excellent 11.8% |
| Immigrants | Hungary | 81.7 /100 | #128 | Excellent 11.8% |
| Ethiopians | 80.7 /100 | #129 | Excellent 11.8% |
| Spanish | 80.5 /100 | #130 | Excellent 11.8% |
| Immigrants | Western Europe | 79.6 /100 | #131 | Good 11.9% |
| Lebanese | 78.3 /100 | #132 | Good 11.9% |
| Immigrants | Sierra Leone | 77.6 /100 | #133 | Good 11.9% |