Icelander vs Alsatian Seniors Poverty Over the Age of 75
COMPARE
Icelander
Alsatian
Seniors Poverty Over the Age of 75
Seniors Poverty Over the Age of 75 Comparison
Icelanders
Alsatians
11.7%
SENIORS POVERTY OVER THE AGE OF 75
85.7/ 100
METRIC RATING
117th/ 347
METRIC RANK
12.6%
SENIORS POVERTY OVER THE AGE OF 75
17.7/ 100
METRIC RATING
194th/ 347
METRIC RANK
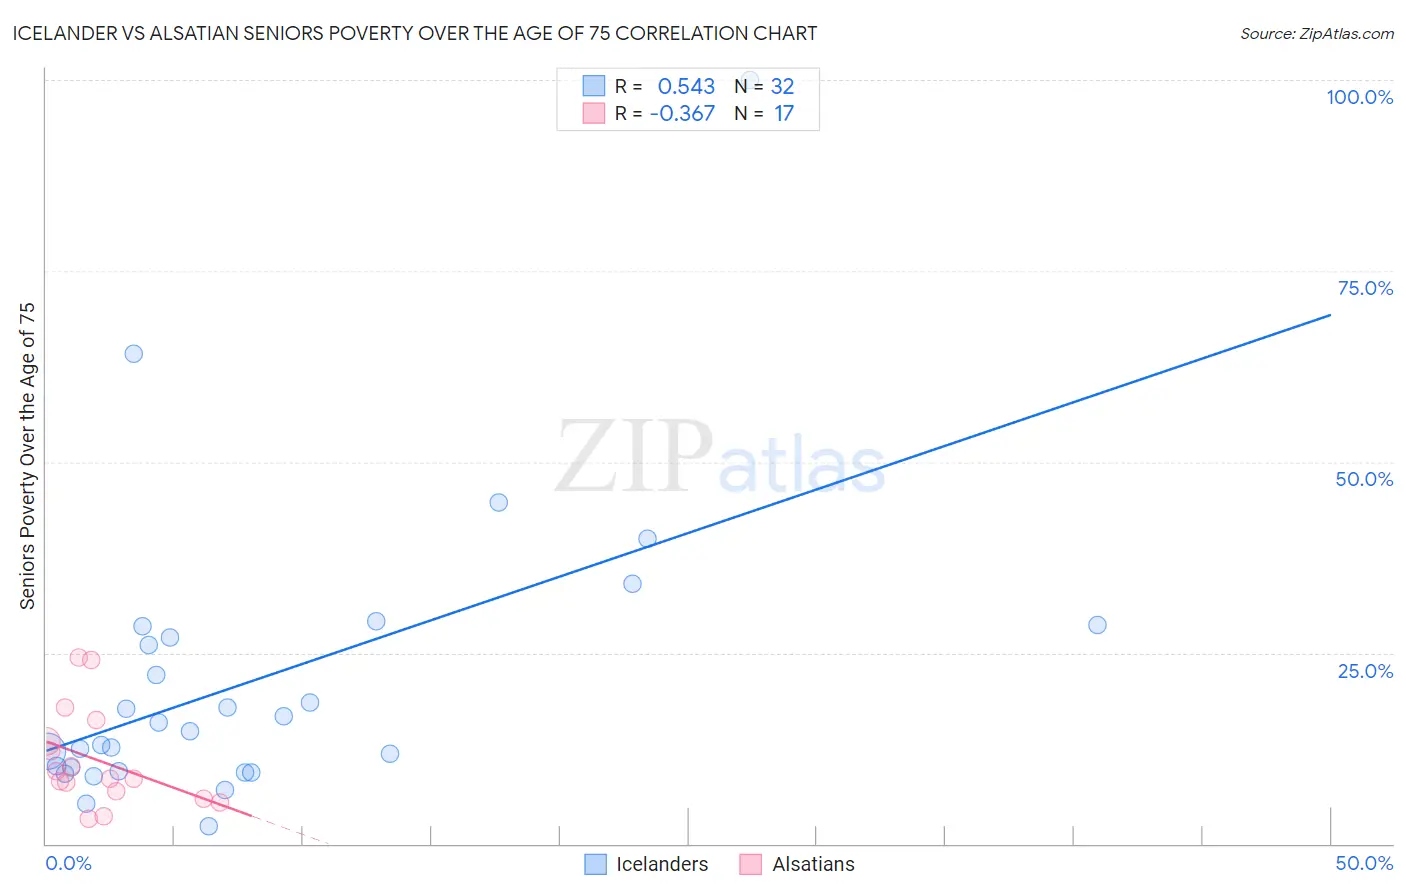
Icelander vs Alsatian Seniors Poverty Over the Age of 75 Correlation Chart
The statistical analysis conducted on geographies consisting of 158,818,038 people shows a substantial positive correlation between the proportion of Icelanders and poverty level among seniors over the age of 75 in the United States with a correlation coefficient (R) of 0.543 and weighted average of 11.7%. Similarly, the statistical analysis conducted on geographies consisting of 82,530,735 people shows a mild negative correlation between the proportion of Alsatians and poverty level among seniors over the age of 75 in the United States with a correlation coefficient (R) of -0.367 and weighted average of 12.6%, a difference of 7.0%.
Seniors Poverty Over the Age of 75 Correlation Summary
| Measurement | Icelander | Alsatian |
| Minimum | 2.3% | 3.3% |
| Maximum | 100.0% | 24.4% |
| Range | 97.7% | 21.2% |
| Mean | 21.5% | 10.9% |
| Median | 15.3% | 8.6% |
| Interquartile 25% (IQ1) | 9.7% | 6.3% |
| Interquartile 75% (IQ3) | 27.7% | 14.8% |
| Interquartile Range (IQR) | 18.0% | 8.4% |
| Standard Deviation (Sample) | 19.4% | 6.4% |
| Standard Deviation (Population) | 19.1% | 6.2% |
Similar Demographics by Seniors Poverty Over the Age of 75
Demographics Similar to Icelanders by Seniors Poverty Over the Age of 75
In terms of seniors poverty over the age of 75, the demographic groups most similar to Icelanders are Immigrants from Zimbabwe (11.7%, a difference of 0.030%), New Zealander (11.7%, a difference of 0.11%), Iraqi (11.7%, a difference of 0.11%), Immigrants from Uganda (11.8%, a difference of 0.16%), and Immigrants from Nepal (11.8%, a difference of 0.20%).
| Demographics | Rating | Rank | Seniors Poverty Over the Age of 75 |
| Immigrants | Jordan | 88.7 /100 | #110 | Excellent 11.7% |
| Burmese | 88.7 /100 | #111 | Excellent 11.7% |
| Immigrants | Bolivia | 88.4 /100 | #112 | Excellent 11.7% |
| Immigrants | Czechoslovakia | 87.0 /100 | #113 | Excellent 11.7% |
| Ukrainians | 86.9 /100 | #114 | Excellent 11.7% |
| New Zealanders | 86.3 /100 | #115 | Excellent 11.7% |
| Iraqis | 86.3 /100 | #116 | Excellent 11.7% |
| Icelanders | 85.7 /100 | #117 | Excellent 11.7% |
| Immigrants | Zimbabwe | 85.5 /100 | #118 | Excellent 11.7% |
| Immigrants | Uganda | 84.8 /100 | #119 | Excellent 11.8% |
| Immigrants | Nepal | 84.5 /100 | #120 | Excellent 11.8% |
| Malaysians | 84.1 /100 | #121 | Excellent 11.8% |
| Pakistanis | 84.0 /100 | #122 | Excellent 11.8% |
| Immigrants | Italy | 84.0 /100 | #123 | Excellent 11.8% |
| Fijians | 83.8 /100 | #124 | Excellent 11.8% |
Demographics Similar to Alsatians by Seniors Poverty Over the Age of 75
In terms of seniors poverty over the age of 75, the demographic groups most similar to Alsatians are Taiwanese (12.6%, a difference of 0.010%), Immigrants from France (12.6%, a difference of 0.050%), Immigrants from Eastern Europe (12.6%, a difference of 0.23%), Choctaw (12.5%, a difference of 0.32%), and Nepalese (12.6%, a difference of 0.49%).
| Demographics | Rating | Rank | Seniors Poverty Over the Age of 75 |
| Yaqui | 25.9 /100 | #187 | Fair 12.5% |
| Immigrants | Northern Africa | 25.2 /100 | #188 | Fair 12.5% |
| Immigrants | Indonesia | 24.4 /100 | #189 | Fair 12.5% |
| Immigrants | Congo | 23.9 /100 | #190 | Fair 12.5% |
| Liberians | 23.2 /100 | #191 | Fair 12.5% |
| Choctaw | 20.2 /100 | #192 | Fair 12.5% |
| Taiwanese | 17.8 /100 | #193 | Poor 12.6% |
| Alsatians | 17.7 /100 | #194 | Poor 12.6% |
| Immigrants | France | 17.4 /100 | #195 | Poor 12.6% |
| Immigrants | Eastern Europe | 16.0 /100 | #196 | Poor 12.6% |
| Nepalese | 14.4 /100 | #197 | Poor 12.6% |
| Chileans | 13.7 /100 | #198 | Poor 12.6% |
| Immigrants | Lebanon | 12.7 /100 | #199 | Poor 12.7% |
| Immigrants | Vietnam | 12.1 /100 | #200 | Poor 12.7% |
| Paraguayans | 11.1 /100 | #201 | Poor 12.7% |