Spanish American vs Pennsylvania German Seniors Poverty Over the Age of 75
COMPARE
Spanish American
Pennsylvania German
Seniors Poverty Over the Age of 75
Seniors Poverty Over the Age of 75 Comparison
Spanish Americans
Pennsylvania Germans
13.5%
SENIORS POVERTY OVER THE AGE OF 75
0.5/ 100
METRIC RATING
244th/ 347
METRIC RANK
11.8%
SENIORS POVERTY OVER THE AGE OF 75
83.4/ 100
METRIC RATING
126th/ 347
METRIC RANK
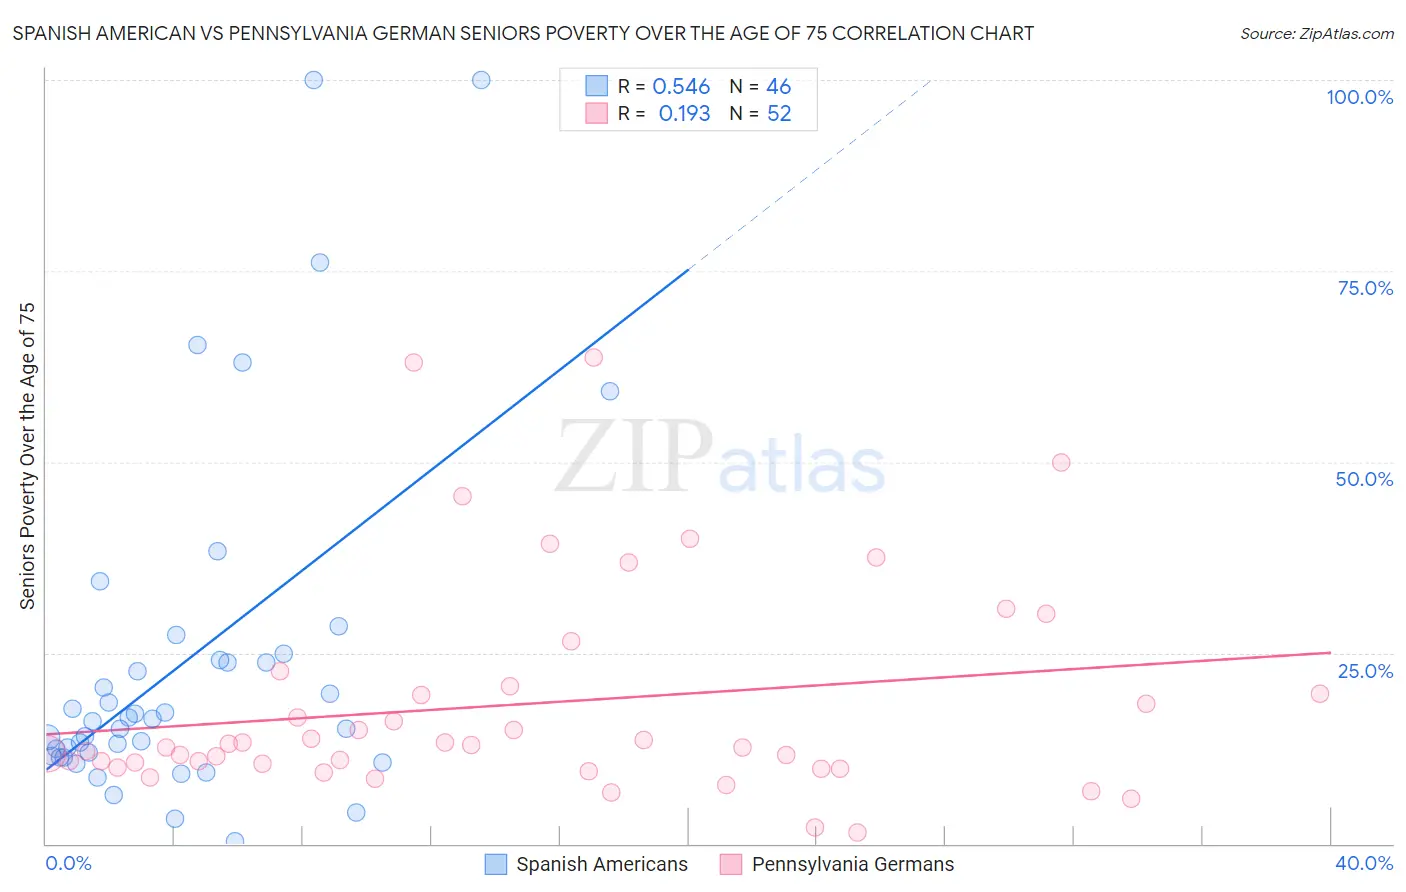
Spanish American vs Pennsylvania German Seniors Poverty Over the Age of 75 Correlation Chart
The statistical analysis conducted on geographies consisting of 102,922,001 people shows a substantial positive correlation between the proportion of Spanish Americans and poverty level among seniors over the age of 75 in the United States with a correlation coefficient (R) of 0.546 and weighted average of 13.5%. Similarly, the statistical analysis conducted on geographies consisting of 232,114,094 people shows a poor positive correlation between the proportion of Pennsylvania Germans and poverty level among seniors over the age of 75 in the United States with a correlation coefficient (R) of 0.193 and weighted average of 11.8%, a difference of 14.5%.
Seniors Poverty Over the Age of 75 Correlation Summary
| Measurement | Spanish American | Pennsylvania German |
| Minimum | 0.28% | 1.5% |
| Maximum | 100.0% | 63.6% |
| Range | 99.7% | 62.2% |
| Mean | 24.0% | 18.3% |
| Median | 16.2% | 12.7% |
| Interquartile 25% (IQ1) | 11.5% | 10.2% |
| Interquartile 75% (IQ3) | 24.1% | 20.2% |
| Interquartile Range (IQR) | 12.6% | 9.9% |
| Standard Deviation (Sample) | 23.0% | 14.2% |
| Standard Deviation (Population) | 22.7% | 14.0% |
Similar Demographics by Seniors Poverty Over the Age of 75
Demographics Similar to Spanish Americans by Seniors Poverty Over the Age of 75
In terms of seniors poverty over the age of 75, the demographic groups most similar to Spanish Americans are Uruguayan (13.5%, a difference of 0.14%), Dutch West Indian (13.5%, a difference of 0.32%), Immigrants from Somalia (13.5%, a difference of 0.34%), Immigrants from Cambodia (13.6%, a difference of 0.37%), and Immigrants from Russia (13.4%, a difference of 0.44%).
| Demographics | Rating | Rank | Seniors Poverty Over the Age of 75 |
| Alaskan Athabascans | 0.8 /100 | #237 | Tragic 13.4% |
| Peruvians | 0.8 /100 | #238 | Tragic 13.4% |
| Panamanians | 0.8 /100 | #239 | Tragic 13.4% |
| Argentineans | 0.7 /100 | #240 | Tragic 13.4% |
| Immigrants | Russia | 0.6 /100 | #241 | Tragic 13.4% |
| Immigrants | Somalia | 0.6 /100 | #242 | Tragic 13.5% |
| Dutch West Indians | 0.6 /100 | #243 | Tragic 13.5% |
| Spanish Americans | 0.5 /100 | #244 | Tragic 13.5% |
| Uruguayans | 0.5 /100 | #245 | Tragic 13.5% |
| Immigrants | Cambodia | 0.4 /100 | #246 | Tragic 13.6% |
| Immigrants | Ukraine | 0.3 /100 | #247 | Tragic 13.6% |
| Africans | 0.3 /100 | #248 | Tragic 13.6% |
| Immigrants | Albania | 0.3 /100 | #249 | Tragic 13.6% |
| Mexican American Indians | 0.3 /100 | #250 | Tragic 13.6% |
| Immigrants | Peru | 0.3 /100 | #251 | Tragic 13.7% |
Demographics Similar to Pennsylvania Germans by Seniors Poverty Over the Age of 75
In terms of seniors poverty over the age of 75, the demographic groups most similar to Pennsylvania Germans are Sudanese (11.8%, a difference of 0.040%), Fijian (11.8%, a difference of 0.060%), Immigrants from Italy (11.8%, a difference of 0.090%), Pakistani (11.8%, a difference of 0.10%), and Malaysian (11.8%, a difference of 0.11%).
| Demographics | Rating | Rank | Seniors Poverty Over the Age of 75 |
| Immigrants | Uganda | 84.8 /100 | #119 | Excellent 11.8% |
| Immigrants | Nepal | 84.5 /100 | #120 | Excellent 11.8% |
| Malaysians | 84.1 /100 | #121 | Excellent 11.8% |
| Pakistanis | 84.0 /100 | #122 | Excellent 11.8% |
| Immigrants | Italy | 84.0 /100 | #123 | Excellent 11.8% |
| Fijians | 83.8 /100 | #124 | Excellent 11.8% |
| Sudanese | 83.6 /100 | #125 | Excellent 11.8% |
| Pennsylvania Germans | 83.4 /100 | #126 | Excellent 11.8% |
| Immigrants | Denmark | 82.6 /100 | #127 | Excellent 11.8% |
| Immigrants | Hungary | 81.7 /100 | #128 | Excellent 11.8% |
| Ethiopians | 80.7 /100 | #129 | Excellent 11.8% |
| Spanish | 80.5 /100 | #130 | Excellent 11.8% |
| Immigrants | Western Europe | 79.6 /100 | #131 | Good 11.9% |
| Lebanese | 78.3 /100 | #132 | Good 11.9% |
| Immigrants | Sierra Leone | 77.6 /100 | #133 | Good 11.9% |