Icelander vs Immigrants from Cuba 9th Grade
COMPARE
Icelander
Immigrants from Cuba
9th Grade
9th Grade Comparison
Icelanders
Immigrants from Cuba
95.7%
9TH GRADE
99.1/ 100
METRIC RATING
85th/ 347
METRIC RANK
92.2%
9TH GRADE
0.0/ 100
METRIC RATING
317th/ 347
METRIC RANK
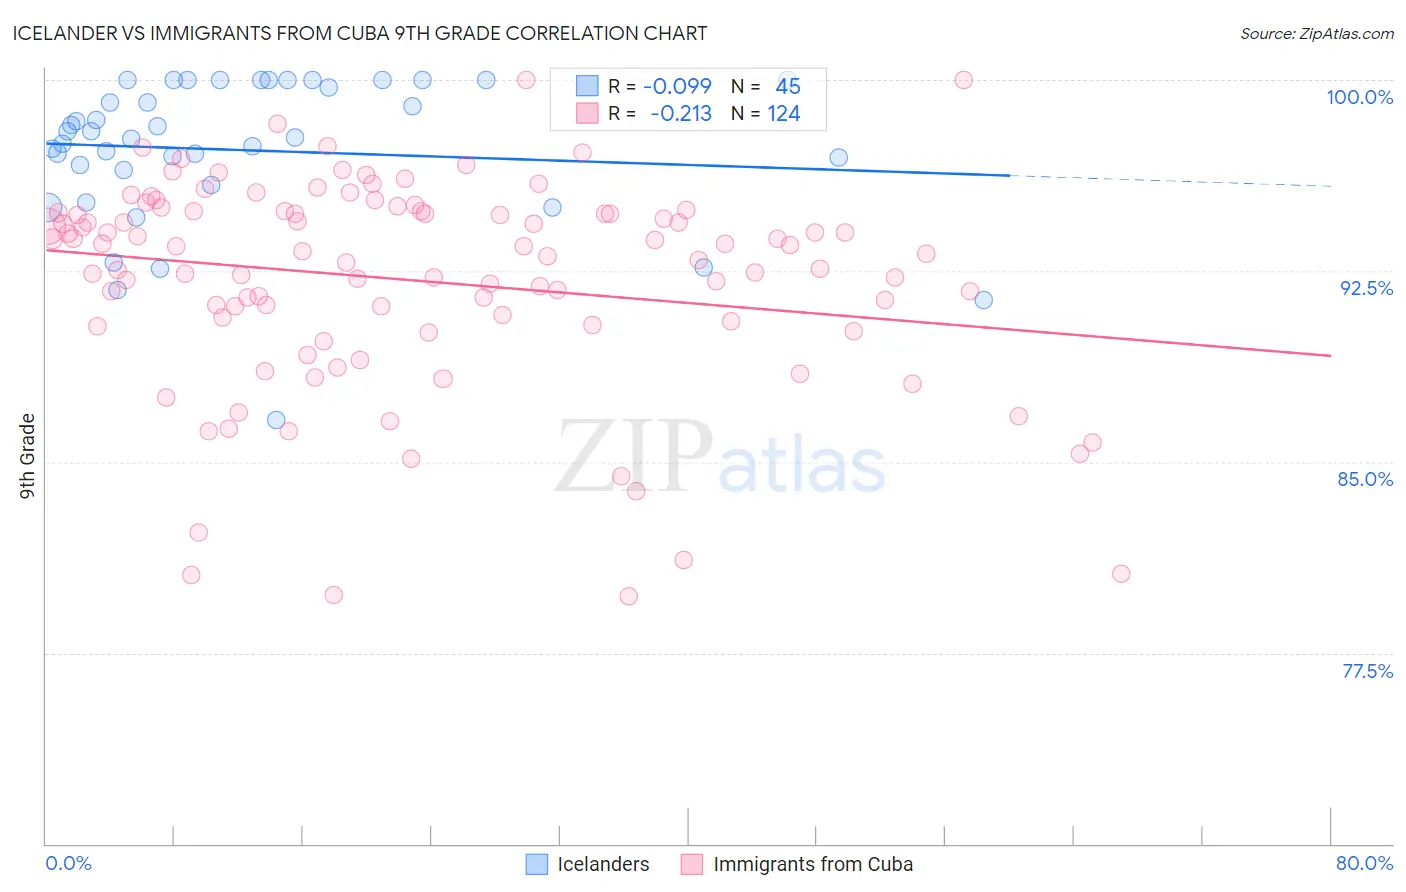
Icelander vs Immigrants from Cuba 9th Grade Correlation Chart
The statistical analysis conducted on geographies consisting of 159,667,064 people shows a slight negative correlation between the proportion of Icelanders and percentage of population with at least 9th grade education in the United States with a correlation coefficient (R) of -0.099 and weighted average of 95.7%. Similarly, the statistical analysis conducted on geographies consisting of 326,019,170 people shows a weak negative correlation between the proportion of Immigrants from Cuba and percentage of population with at least 9th grade education in the United States with a correlation coefficient (R) of -0.213 and weighted average of 92.2%, a difference of 3.8%.
9th Grade Correlation Summary
| Measurement | Icelander | Immigrants from Cuba |
| Minimum | 86.7% | 79.7% |
| Maximum | 100.0% | 100.0% |
| Range | 13.3% | 20.3% |
| Mean | 97.2% | 92.1% |
| Median | 97.7% | 93.2% |
| Interquartile 25% (IQ1) | 96.2% | 90.5% |
| Interquartile 75% (IQ3) | 100.0% | 94.8% |
| Interquartile Range (IQR) | 3.8% | 4.4% |
| Standard Deviation (Sample) | 2.9% | 4.1% |
| Standard Deviation (Population) | 2.9% | 4.1% |
Similar Demographics by 9th Grade
Demographics Similar to Icelanders by 9th Grade
In terms of 9th grade, the demographic groups most similar to Icelanders are Immigrants from Denmark (95.7%, a difference of 0.0%), Immigrants from Western Europe (95.7%, a difference of 0.0%), Swiss (95.7%, a difference of 0.010%), Bhutanese (95.7%, a difference of 0.030%), and Arapaho (95.7%, a difference of 0.030%).
| Demographics | Rating | Rank | 9th Grade |
| Immigrants | South Africa | 99.4 /100 | #78 | Exceptional 95.8% |
| Romanians | 99.3 /100 | #79 | Exceptional 95.7% |
| Bhutanese | 99.3 /100 | #80 | Exceptional 95.7% |
| Arapaho | 99.3 /100 | #81 | Exceptional 95.7% |
| Puget Sound Salish | 99.2 /100 | #82 | Exceptional 95.7% |
| Swiss | 99.2 /100 | #83 | Exceptional 95.7% |
| Immigrants | Denmark | 99.1 /100 | #84 | Exceptional 95.7% |
| Icelanders | 99.1 /100 | #85 | Exceptional 95.7% |
| Immigrants | Western Europe | 99.1 /100 | #86 | Exceptional 95.7% |
| Okinawans | 99.0 /100 | #87 | Exceptional 95.7% |
| Immigrants | Czechoslovakia | 98.9 /100 | #88 | Exceptional 95.7% |
| Yugoslavians | 98.9 /100 | #89 | Exceptional 95.7% |
| South Africans | 98.8 /100 | #90 | Exceptional 95.6% |
| Creek | 98.8 /100 | #91 | Exceptional 95.6% |
| Immigrants | Saudi Arabia | 98.8 /100 | #92 | Exceptional 95.6% |
Demographics Similar to Immigrants from Cuba by 9th Grade
In terms of 9th grade, the demographic groups most similar to Immigrants from Cuba are Cape Verdean (92.2%, a difference of 0.010%), Immigrants from Caribbean (92.2%, a difference of 0.050%), Immigrants from Portugal (92.2%, a difference of 0.060%), Vietnamese (92.3%, a difference of 0.10%), and Houma (92.3%, a difference of 0.12%).
| Demographics | Rating | Rank | 9th Grade |
| Immigrants | Cambodia | 0.0 /100 | #310 | Tragic 92.4% |
| Immigrants | Fiji | 0.0 /100 | #311 | Tragic 92.3% |
| Houma | 0.0 /100 | #312 | Tragic 92.3% |
| Vietnamese | 0.0 /100 | #313 | Tragic 92.3% |
| Immigrants | Portugal | 0.0 /100 | #314 | Tragic 92.2% |
| Immigrants | Caribbean | 0.0 /100 | #315 | Tragic 92.2% |
| Cape Verdeans | 0.0 /100 | #316 | Tragic 92.2% |
| Immigrants | Cuba | 0.0 /100 | #317 | Tragic 92.2% |
| Nepalese | 0.0 /100 | #318 | Tragic 92.0% |
| Ecuadorians | 0.0 /100 | #319 | Tragic 91.9% |
| Nicaraguans | 0.0 /100 | #320 | Tragic 91.9% |
| Immigrants | Ecuador | 0.0 /100 | #321 | Tragic 91.8% |
| Belizeans | 0.0 /100 | #322 | Tragic 91.8% |
| Puerto Ricans | 0.0 /100 | #323 | Tragic 91.8% |
| Immigrants | Belize | 0.0 /100 | #324 | Tragic 91.8% |