Immigrants from Senegal vs Ugandan Poverty
COMPARE
Immigrants from Senegal
Ugandan
Poverty
Poverty Comparison
Immigrants from Senegal
Ugandans
15.3%
POVERTY
0.0/ 100
METRIC RATING
298th/ 347
METRIC RANK
13.1%
POVERTY
6.2/ 100
METRIC RATING
208th/ 347
METRIC RANK
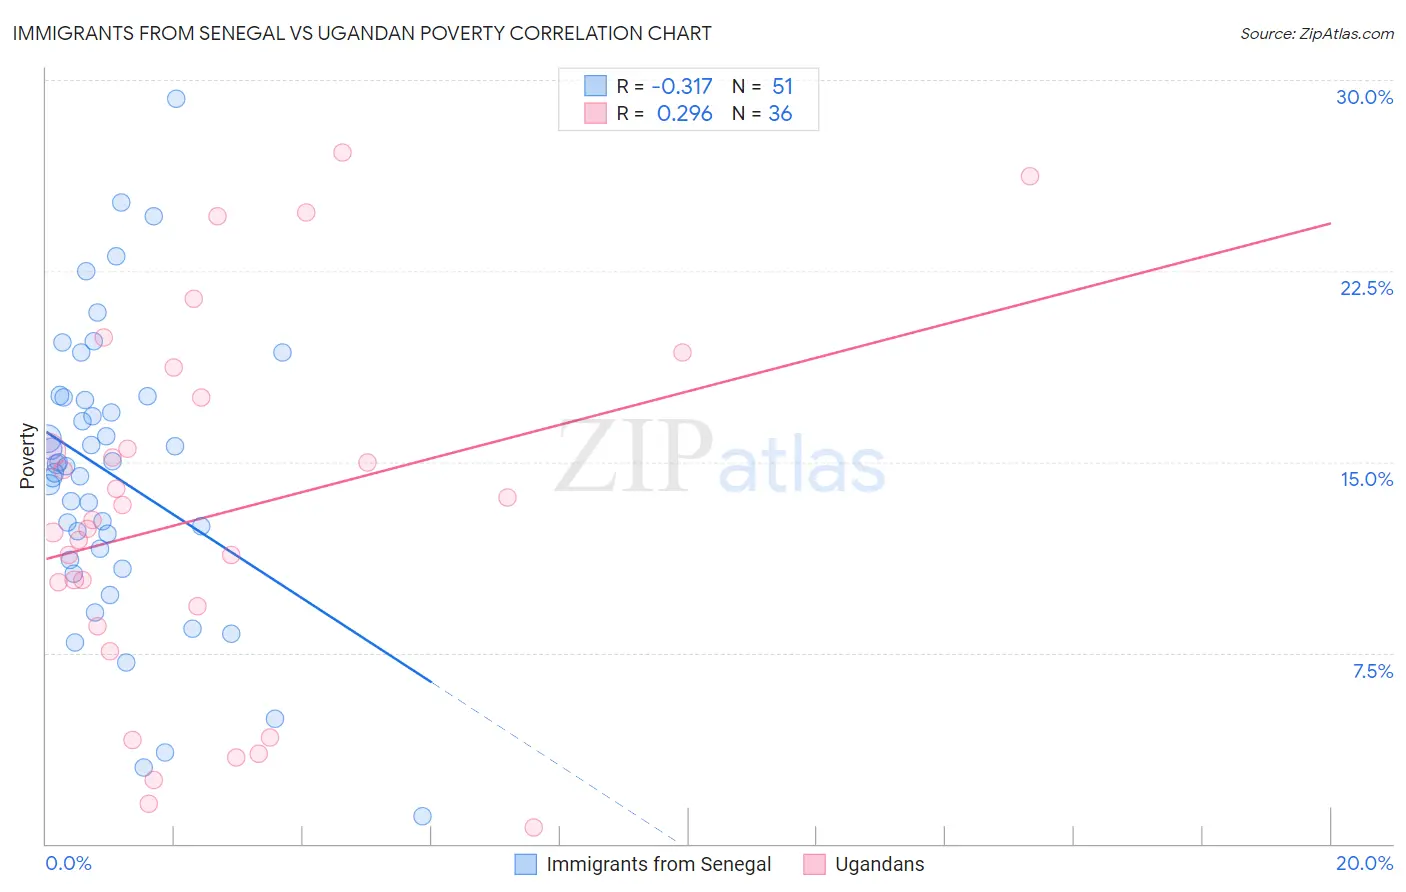
Immigrants from Senegal vs Ugandan Poverty Correlation Chart
The statistical analysis conducted on geographies consisting of 90,124,695 people shows a mild negative correlation between the proportion of Immigrants from Senegal and poverty level in the United States with a correlation coefficient (R) of -0.317 and weighted average of 15.3%. Similarly, the statistical analysis conducted on geographies consisting of 93,996,476 people shows a weak positive correlation between the proportion of Ugandans and poverty level in the United States with a correlation coefficient (R) of 0.296 and weighted average of 13.1%, a difference of 16.5%.
Poverty Correlation Summary
| Measurement | Immigrants from Senegal | Ugandan |
| Minimum | 1.1% | 0.63% |
| Maximum | 29.3% | 27.1% |
| Range | 28.2% | 26.5% |
| Mean | 14.4% | 12.9% |
| Median | 14.8% | 12.5% |
| Interquartile 25% (IQ1) | 11.1% | 8.9% |
| Interquartile 75% (IQ3) | 17.5% | 16.5% |
| Interquartile Range (IQR) | 6.4% | 7.6% |
| Standard Deviation (Sample) | 5.6% | 7.0% |
| Standard Deviation (Population) | 5.6% | 6.9% |
Similar Demographics by Poverty
Demographics Similar to Immigrants from Senegal by Poverty
In terms of poverty, the demographic groups most similar to Immigrants from Senegal are Senegalese (15.3%, a difference of 0.090%), Immigrants from Bangladesh (15.3%, a difference of 0.15%), Hispanic or Latino (15.3%, a difference of 0.19%), Guatemalan (15.3%, a difference of 0.20%), and Immigrants from Central America (15.4%, a difference of 0.47%).
| Demographics | Rating | Rank | Poverty |
| Immigrants | Cabo Verde | 0.0 /100 | #291 | Tragic 15.1% |
| Indonesians | 0.0 /100 | #292 | Tragic 15.1% |
| Immigrants | Zaire | 0.0 /100 | #293 | Tragic 15.1% |
| Blackfeet | 0.0 /100 | #294 | Tragic 15.2% |
| Guatemalans | 0.0 /100 | #295 | Tragic 15.3% |
| Hispanics or Latinos | 0.0 /100 | #296 | Tragic 15.3% |
| Immigrants | Bangladesh | 0.0 /100 | #297 | Tragic 15.3% |
| Immigrants | Senegal | 0.0 /100 | #298 | Tragic 15.3% |
| Senegalese | 0.0 /100 | #299 | Tragic 15.3% |
| Immigrants | Central America | 0.0 /100 | #300 | Tragic 15.4% |
| Bahamians | 0.0 /100 | #301 | Tragic 15.4% |
| Somalis | 0.0 /100 | #302 | Tragic 15.4% |
| Immigrants | Caribbean | 0.0 /100 | #303 | Tragic 15.5% |
| Immigrants | Mexico | 0.0 /100 | #304 | Tragic 15.5% |
| Immigrants | Guatemala | 0.0 /100 | #305 | Tragic 15.5% |
Demographics Similar to Ugandans by Poverty
In terms of poverty, the demographic groups most similar to Ugandans are Malaysian (13.1%, a difference of 0.030%), Immigrants from the Azores (13.1%, a difference of 0.060%), Panamanian (13.1%, a difference of 0.15%), Immigrants from Eastern Africa (13.1%, a difference of 0.27%), and Moroccan (13.2%, a difference of 0.42%).
| Demographics | Rating | Rank | Poverty |
| Immigrants | Uganda | 16.5 /100 | #201 | Poor 12.8% |
| Immigrants | Uruguay | 15.6 /100 | #202 | Poor 12.8% |
| Hmong | 15.0 /100 | #203 | Poor 12.8% |
| Immigrants | Western Asia | 14.1 /100 | #204 | Poor 12.9% |
| Tsimshian | 9.2 /100 | #205 | Tragic 13.0% |
| Immigrants | Eastern Africa | 7.0 /100 | #206 | Tragic 13.1% |
| Panamanians | 6.6 /100 | #207 | Tragic 13.1% |
| Ugandans | 6.2 /100 | #208 | Tragic 13.1% |
| Malaysians | 6.1 /100 | #209 | Tragic 13.1% |
| Immigrants | Azores | 6.1 /100 | #210 | Tragic 13.1% |
| Moroccans | 5.2 /100 | #211 | Tragic 13.2% |
| Immigrants | Immigrants | 4.3 /100 | #212 | Tragic 13.2% |
| Immigrants | Panama | 4.1 /100 | #213 | Tragic 13.3% |
| Bermudans | 3.7 /100 | #214 | Tragic 13.3% |
| Japanese | 3.3 /100 | #215 | Tragic 13.3% |