Hungarian vs Immigrants from Lithuania In Labor Force | Age 45-54
COMPARE
Hungarian
Immigrants from Lithuania
In Labor Force | Age 45-54
In Labor Force | Age 45-54 Comparison
Hungarians
Immigrants from Lithuania
82.7%
IN LABOR FORCE | AGE 45-54
38.0/ 100
METRIC RATING
180th/ 347
METRIC RANK
83.9%
IN LABOR FORCE | AGE 45-54
99.8/ 100
METRIC RATING
28th/ 347
METRIC RANK
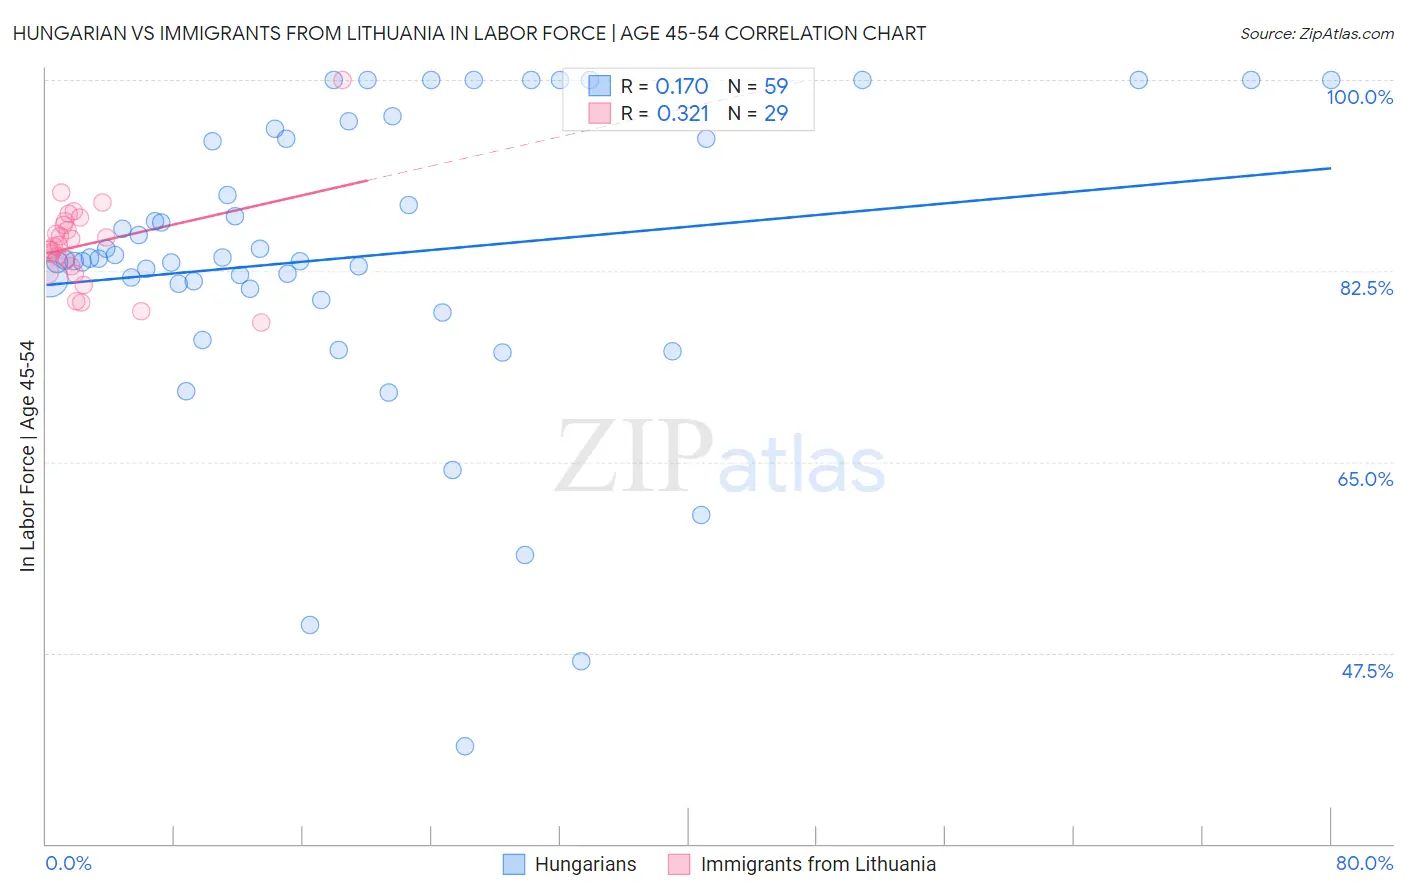
Hungarian vs Immigrants from Lithuania In Labor Force | Age 45-54 Correlation Chart
The statistical analysis conducted on geographies consisting of 485,857,065 people shows a poor positive correlation between the proportion of Hungarians and labor force participation rate among population between the ages 45 and 54 in the United States with a correlation coefficient (R) of 0.170 and weighted average of 82.7%. Similarly, the statistical analysis conducted on geographies consisting of 117,719,055 people shows a mild positive correlation between the proportion of Immigrants from Lithuania and labor force participation rate among population between the ages 45 and 54 in the United States with a correlation coefficient (R) of 0.321 and weighted average of 83.9%, a difference of 1.4%.
In Labor Force | Age 45-54 Correlation Summary
| Measurement | Hungarian | Immigrants from Lithuania |
| Minimum | 38.9% | 77.8% |
| Maximum | 100.0% | 100.0% |
| Range | 61.1% | 22.2% |
| Mean | 83.8% | 84.9% |
| Median | 83.6% | 84.8% |
| Interquartile 25% (IQ1) | 80.9% | 82.7% |
| Interquartile 75% (IQ3) | 94.6% | 86.9% |
| Interquartile Range (IQR) | 13.7% | 4.2% |
| Standard Deviation (Sample) | 13.6% | 4.1% |
| Standard Deviation (Population) | 13.5% | 4.1% |
Similar Demographics by In Labor Force | Age 45-54
Demographics Similar to Hungarians by In Labor Force | Age 45-54
In terms of in labor force | age 45-54, the demographic groups most similar to Hungarians are Israeli (82.7%, a difference of 0.0%), Immigrants from Switzerland (82.7%, a difference of 0.010%), Immigrants from Hungary (82.7%, a difference of 0.010%), Nigerian (82.7%, a difference of 0.020%), and New Zealander (82.6%, a difference of 0.050%).
| Demographics | Rating | Rank | In Labor Force | Age 45-54 |
| Nicaraguans | 50.3 /100 | #173 | Average 82.8% |
| Costa Ricans | 50.0 /100 | #174 | Average 82.8% |
| Immigrants | Liberia | 47.9 /100 | #175 | Average 82.7% |
| Northern Europeans | 46.9 /100 | #176 | Average 82.7% |
| Immigrants | Nicaragua | 44.6 /100 | #177 | Average 82.7% |
| Nigerians | 40.5 /100 | #178 | Average 82.7% |
| Immigrants | Switzerland | 39.4 /100 | #179 | Fair 82.7% |
| Hungarians | 38.0 /100 | #180 | Fair 82.7% |
| Israelis | 37.7 /100 | #181 | Fair 82.7% |
| Immigrants | Hungary | 37.1 /100 | #182 | Fair 82.7% |
| New Zealanders | 32.7 /100 | #183 | Fair 82.6% |
| Europeans | 32.6 /100 | #184 | Fair 82.6% |
| Immigrants | England | 32.2 /100 | #185 | Fair 82.6% |
| Irish | 29.2 /100 | #186 | Fair 82.6% |
| Immigrants | Costa Rica | 28.3 /100 | #187 | Fair 82.6% |
Demographics Similar to Immigrants from Lithuania by In Labor Force | Age 45-54
In terms of in labor force | age 45-54, the demographic groups most similar to Immigrants from Lithuania are Immigrants from Brazil (83.9%, a difference of 0.010%), Immigrants from Serbia (83.9%, a difference of 0.020%), Immigrants from Pakistan (83.8%, a difference of 0.020%), Immigrants from North Macedonia (83.9%, a difference of 0.030%), and Immigrants from Bulgaria (83.8%, a difference of 0.040%).
| Demographics | Rating | Rank | In Labor Force | Age 45-54 |
| Immigrants | Sri Lanka | 99.8 /100 | #21 | Exceptional 83.9% |
| Immigrants | Ireland | 99.8 /100 | #22 | Exceptional 83.9% |
| Tlingit-Haida | 99.8 /100 | #23 | Exceptional 83.9% |
| Slovenes | 99.8 /100 | #24 | Exceptional 83.9% |
| Immigrants | North Macedonia | 99.8 /100 | #25 | Exceptional 83.9% |
| Immigrants | Serbia | 99.8 /100 | #26 | Exceptional 83.9% |
| Immigrants | Brazil | 99.8 /100 | #27 | Exceptional 83.9% |
| Immigrants | Lithuania | 99.8 /100 | #28 | Exceptional 83.9% |
| Immigrants | Pakistan | 99.7 /100 | #29 | Exceptional 83.8% |
| Immigrants | Bulgaria | 99.7 /100 | #30 | Exceptional 83.8% |
| Immigrants | Eritrea | 99.7 /100 | #31 | Exceptional 83.8% |
| Turks | 99.7 /100 | #32 | Exceptional 83.8% |
| Latvians | 99.7 /100 | #33 | Exceptional 83.8% |
| Kenyans | 99.5 /100 | #34 | Exceptional 83.7% |
| Brazilians | 99.5 /100 | #35 | Exceptional 83.7% |