Fijian vs Immigrants from Canada Child Poverty Among Boys Under 16
COMPARE
Fijian
Immigrants from Canada
Child Poverty Among Boys Under 16
Child Poverty Among Boys Under 16 Comparison
Fijians
Immigrants from Canada
18.3%
CHILD POVERTY AMONG BOYS UNDER 16
1.8/ 100
METRIC RATING
230th/ 347
METRIC RANK
14.7%
CHILD POVERTY AMONG BOYS UNDER 16
97.6/ 100
METRIC RATING
81st/ 347
METRIC RANK
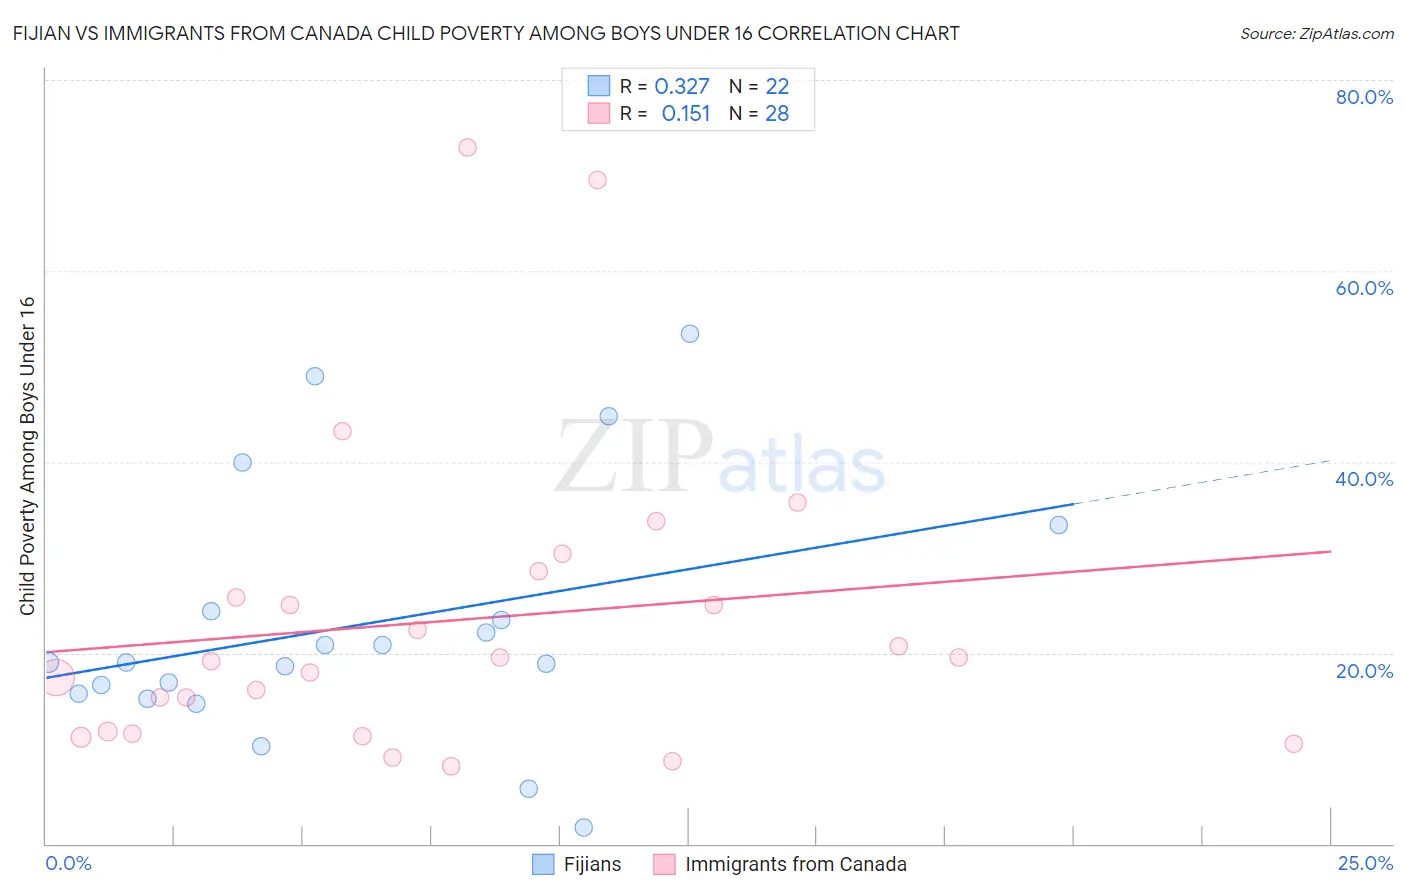
Fijian vs Immigrants from Canada Child Poverty Among Boys Under 16 Correlation Chart
The statistical analysis conducted on geographies consisting of 55,842,627 people shows a mild positive correlation between the proportion of Fijians and poverty level among boys under the age of 16 in the United States with a correlation coefficient (R) of 0.327 and weighted average of 18.3%. Similarly, the statistical analysis conducted on geographies consisting of 448,274,828 people shows a poor positive correlation between the proportion of Immigrants from Canada and poverty level among boys under the age of 16 in the United States with a correlation coefficient (R) of 0.151 and weighted average of 14.7%, a difference of 24.0%.
Child Poverty Among Boys Under 16 Correlation Summary
| Measurement | Fijian | Immigrants from Canada |
| Minimum | 1.7% | 8.1% |
| Maximum | 53.4% | 72.9% |
| Range | 51.7% | 64.8% |
| Mean | 22.9% | 23.4% |
| Median | 19.0% | 19.3% |
| Interquartile 25% (IQ1) | 15.8% | 11.6% |
| Interquartile 75% (IQ3) | 24.4% | 27.2% |
| Interquartile Range (IQR) | 8.6% | 15.6% |
| Standard Deviation (Sample) | 13.3% | 16.1% |
| Standard Deviation (Population) | 13.0% | 15.8% |
Similar Demographics by Child Poverty Among Boys Under 16
Demographics Similar to Fijians by Child Poverty Among Boys Under 16
In terms of child poverty among boys under 16, the demographic groups most similar to Fijians are Immigrants from Micronesia (18.3%, a difference of 0.0%), Nonimmigrants (18.2%, a difference of 0.52%), Nicaraguan (18.4%, a difference of 0.53%), Marshallese (18.4%, a difference of 0.73%), and Bermudan (18.1%, a difference of 0.85%).
| Demographics | Rating | Rank | Child Poverty Among Boys Under 16 |
| Cubans | 3.8 /100 | #223 | Tragic 17.9% |
| Nepalese | 3.2 /100 | #224 | Tragic 18.0% |
| Inupiat | 2.7 /100 | #225 | Tragic 18.1% |
| Immigrants | Africa | 2.6 /100 | #226 | Tragic 18.1% |
| Bermudans | 2.5 /100 | #227 | Tragic 18.1% |
| Immigrants | Nonimmigrants | 2.2 /100 | #228 | Tragic 18.2% |
| Immigrants | Micronesia | 1.8 /100 | #229 | Tragic 18.3% |
| Fijians | 1.8 /100 | #230 | Tragic 18.3% |
| Nicaraguans | 1.4 /100 | #231 | Tragic 18.4% |
| Marshallese | 1.3 /100 | #232 | Tragic 18.4% |
| Immigrants | Nigeria | 1.2 /100 | #233 | Tragic 18.4% |
| Nigerians | 1.1 /100 | #234 | Tragic 18.5% |
| Americans | 0.9 /100 | #235 | Tragic 18.6% |
| Sudanese | 0.9 /100 | #236 | Tragic 18.6% |
| Immigrants | Eritrea | 0.8 /100 | #237 | Tragic 18.6% |
Demographics Similar to Immigrants from Canada by Child Poverty Among Boys Under 16
In terms of child poverty among boys under 16, the demographic groups most similar to Immigrants from Canada are Ukrainian (14.7%, a difference of 0.020%), Immigrants from Russia (14.7%, a difference of 0.14%), Immigrants from Eastern Europe (14.7%, a difference of 0.22%), Immigrants from South Africa (14.8%, a difference of 0.26%), and Egyptian (14.7%, a difference of 0.33%).
| Demographics | Rating | Rank | Child Poverty Among Boys Under 16 |
| Australians | 98.0 /100 | #74 | Exceptional 14.7% |
| Immigrants | Poland | 97.9 /100 | #75 | Exceptional 14.7% |
| Immigrants | Croatia | 97.9 /100 | #76 | Exceptional 14.7% |
| Macedonians | 97.9 /100 | #77 | Exceptional 14.7% |
| Egyptians | 97.8 /100 | #78 | Exceptional 14.7% |
| Immigrants | Eastern Europe | 97.8 /100 | #79 | Exceptional 14.7% |
| Immigrants | Russia | 97.7 /100 | #80 | Exceptional 14.7% |
| Immigrants | Canada | 97.6 /100 | #81 | Exceptional 14.7% |
| Ukrainians | 97.6 /100 | #82 | Exceptional 14.7% |
| Immigrants | South Africa | 97.4 /100 | #83 | Exceptional 14.8% |
| Swiss | 97.3 /100 | #84 | Exceptional 14.8% |
| Taiwanese | 97.3 /100 | #85 | Exceptional 14.8% |
| Germans | 97.2 /100 | #86 | Exceptional 14.8% |
| Northern Europeans | 97.2 /100 | #87 | Exceptional 14.8% |
| Immigrants | North America | 97.1 /100 | #88 | Exceptional 14.8% |