Hungarian vs Immigrants from Canada Householder Income Ages 25 - 44 years
COMPARE
Hungarian
Immigrants from Canada
Householder Income Ages 25 - 44 years
Householder Income Ages 25 - 44 years Comparison
Hungarians
Immigrants from Canada
$97,544
HOUSEHOLDER INCOME AGES 25 - 44 YEARS
83.9/ 100
METRIC RATING
136th/ 347
METRIC RANK
$102,616
HOUSEHOLDER INCOME AGES 25 - 44 YEARS
98.9/ 100
METRIC RATING
88th/ 347
METRIC RANK
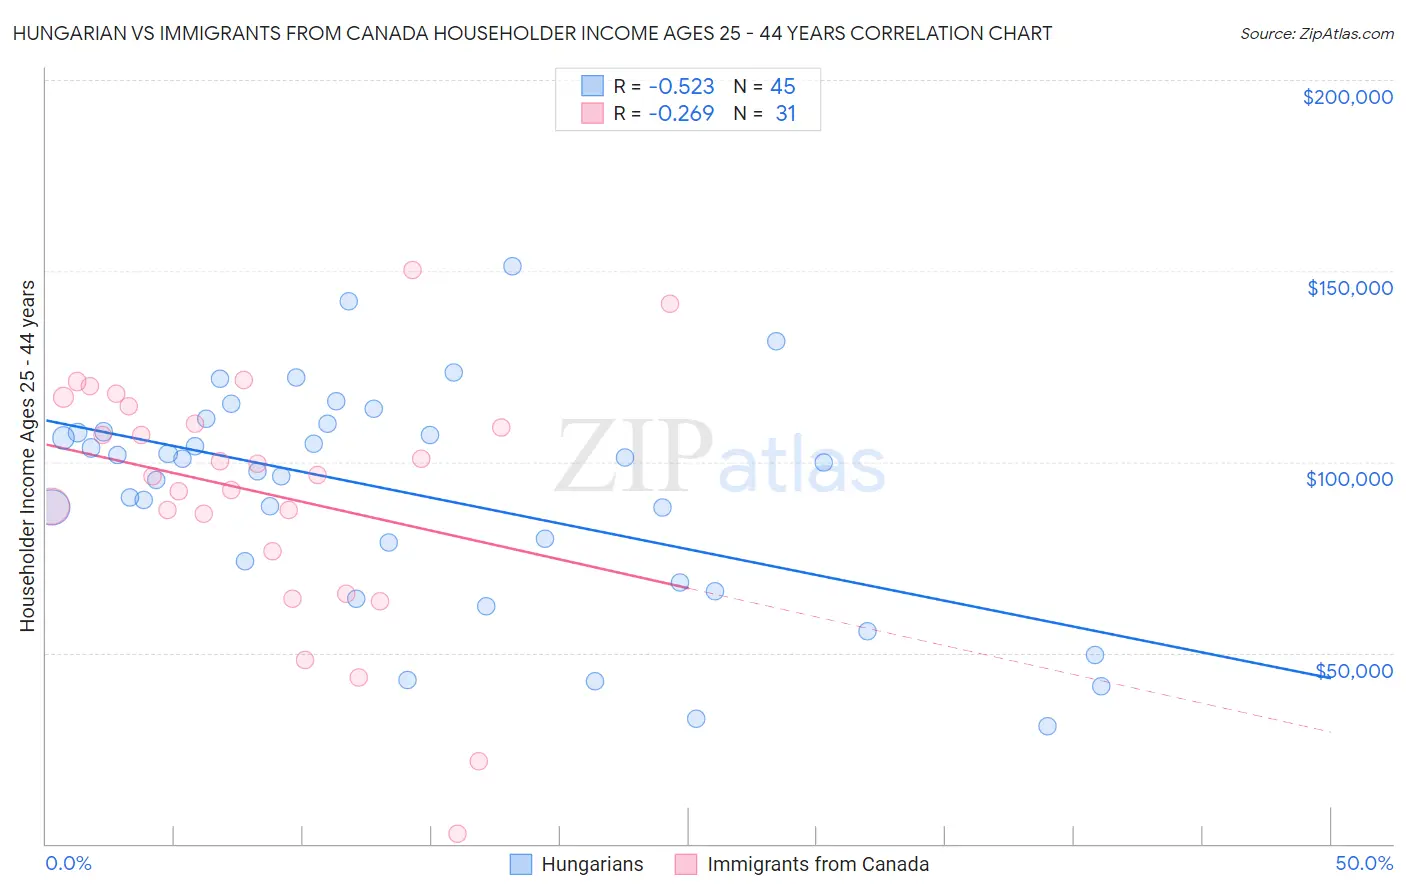
Hungarian vs Immigrants from Canada Householder Income Ages 25 - 44 years Correlation Chart
The statistical analysis conducted on geographies consisting of 483,887,242 people shows a substantial negative correlation between the proportion of Hungarians and household income with householder between the ages 25 and 44 in the United States with a correlation coefficient (R) of -0.523 and weighted average of $97,544. Similarly, the statistical analysis conducted on geographies consisting of 457,590,817 people shows a weak negative correlation between the proportion of Immigrants from Canada and household income with householder between the ages 25 and 44 in the United States with a correlation coefficient (R) of -0.269 and weighted average of $102,616, a difference of 5.2%.
Householder Income Ages 25 - 44 years Correlation Summary
| Measurement | Hungarian | Immigrants from Canada |
| Minimum | $30,767 | $2,499 |
| Maximum | $151,106 | $150,179 |
| Range | $120,339 | $147,680 |
| Mean | $91,740 | $91,907 |
| Median | $99,722 | $96,656 |
| Interquartile 25% (IQ1) | $71,255 | $76,535 |
| Interquartile 75% (IQ3) | $108,880 | $114,617 |
| Interquartile Range (IQR) | $37,626 | $38,082 |
| Standard Deviation (Sample) | $28,566 | $32,277 |
| Standard Deviation (Population) | $28,247 | $31,752 |
Similar Demographics by Householder Income Ages 25 - 44 years
Demographics Similar to Hungarians by Householder Income Ages 25 - 44 years
In terms of householder income ages 25 - 44 years, the demographic groups most similar to Hungarians are Canadian ($97,625, a difference of 0.080%), Immigrants from Oceania ($97,623, a difference of 0.080%), Lebanese ($97,339, a difference of 0.21%), Arab ($97,336, a difference of 0.21%), and Immigrants from Peru ($97,329, a difference of 0.22%).
| Demographics | Rating | Rank | Householder Income Ages 25 - 44 years |
| Brazilians | 88.6 /100 | #129 | Excellent $98,267 |
| Immigrants | Kuwait | 87.8 /100 | #130 | Excellent $98,122 |
| Immigrants | Albania | 86.6 /100 | #131 | Excellent $97,929 |
| Immigrants | Zimbabwe | 86.3 /100 | #132 | Excellent $97,880 |
| Tsimshian | 85.8 /100 | #133 | Excellent $97,809 |
| Canadians | 84.5 /100 | #134 | Excellent $97,625 |
| Immigrants | Oceania | 84.5 /100 | #135 | Excellent $97,623 |
| Hungarians | 83.9 /100 | #136 | Excellent $97,544 |
| Lebanese | 82.3 /100 | #137 | Excellent $97,339 |
| Arabs | 82.3 /100 | #138 | Excellent $97,336 |
| Immigrants | Peru | 82.2 /100 | #139 | Excellent $97,329 |
| Immigrants | Morocco | 82.0 /100 | #140 | Excellent $97,305 |
| Luxembourgers | 81.5 /100 | #141 | Excellent $97,237 |
| Danes | 81.3 /100 | #142 | Excellent $97,221 |
| Immigrants | Jordan | 81.0 /100 | #143 | Excellent $97,185 |
Demographics Similar to Immigrants from Canada by Householder Income Ages 25 - 44 years
In terms of householder income ages 25 - 44 years, the demographic groups most similar to Immigrants from Canada are Immigrants from Hungary ($102,655, a difference of 0.040%), Immigrants from Western Europe ($102,654, a difference of 0.040%), Immigrants from Ukraine ($102,664, a difference of 0.050%), Romanian ($102,544, a difference of 0.070%), and Ukrainian ($102,451, a difference of 0.16%).
| Demographics | Rating | Rank | Householder Income Ages 25 - 44 years |
| South Africans | 99.2 /100 | #81 | Exceptional $103,160 |
| Immigrants | Serbia | 99.2 /100 | #82 | Exceptional $103,155 |
| Argentineans | 99.1 /100 | #83 | Exceptional $103,111 |
| Immigrants | Philippines | 99.0 /100 | #84 | Exceptional $102,910 |
| Immigrants | Ukraine | 98.9 /100 | #85 | Exceptional $102,664 |
| Immigrants | Hungary | 98.9 /100 | #86 | Exceptional $102,655 |
| Immigrants | Western Europe | 98.9 /100 | #87 | Exceptional $102,654 |
| Immigrants | Canada | 98.9 /100 | #88 | Exceptional $102,616 |
| Romanians | 98.8 /100 | #89 | Exceptional $102,544 |
| Ukrainians | 98.8 /100 | #90 | Exceptional $102,451 |
| Croatians | 98.7 /100 | #91 | Exceptional $102,414 |
| Immigrants | North America | 98.7 /100 | #92 | Exceptional $102,407 |
| Immigrants | England | 98.4 /100 | #93 | Exceptional $102,020 |
| Sri Lankans | 98.4 /100 | #94 | Exceptional $101,960 |
| Assyrians/Chaldeans/Syriacs | 98.3 /100 | #95 | Exceptional $101,936 |