Houma vs Immigrants from South Eastern Asia Single Female Poverty
COMPARE
Houma
Immigrants from South Eastern Asia
Single Female Poverty
Single Female Poverty Comparison
Houma
Immigrants from South Eastern Asia
33.8%
SINGLE FEMALE POVERTY
0.0/ 100
METRIC RATING
345th/ 347
METRIC RANK
19.3%
SINGLE FEMALE POVERTY
99.4/ 100
METRIC RATING
71st/ 347
METRIC RANK
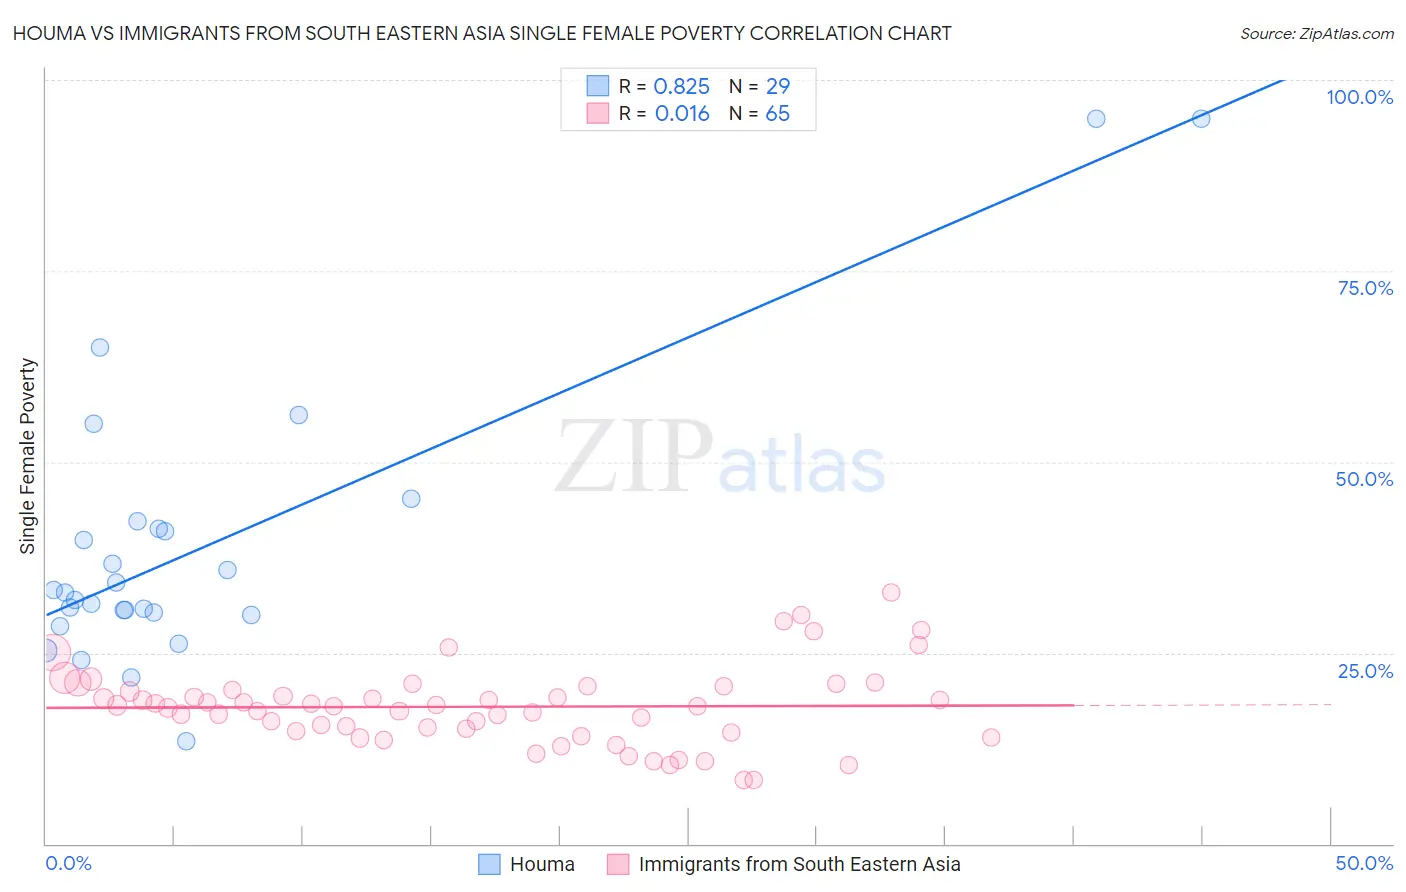
Houma vs Immigrants from South Eastern Asia Single Female Poverty Correlation Chart
The statistical analysis conducted on geographies consisting of 36,729,698 people shows a very strong positive correlation between the proportion of Houma and poverty level among single females in the United States with a correlation coefficient (R) of 0.825 and weighted average of 33.8%. Similarly, the statistical analysis conducted on geographies consisting of 500,482,626 people shows no correlation between the proportion of Immigrants from South Eastern Asia and poverty level among single females in the United States with a correlation coefficient (R) of 0.016 and weighted average of 19.3%, a difference of 74.9%.
Single Female Poverty Correlation Summary
| Measurement | Houma | Immigrants from South Eastern Asia |
| Minimum | 13.4% | 8.3% |
| Maximum | 94.8% | 33.0% |
| Range | 81.5% | 24.7% |
| Mean | 39.1% | 17.9% |
| Median | 33.0% | 18.0% |
| Interquartile 25% (IQ1) | 30.1% | 14.7% |
| Interquartile 75% (IQ3) | 41.8% | 20.4% |
| Interquartile Range (IQR) | 11.6% | 5.8% |
| Standard Deviation (Sample) | 18.7% | 5.1% |
| Standard Deviation (Population) | 18.4% | 5.1% |
Similar Demographics by Single Female Poverty
Demographics Similar to Houma by Single Female Poverty
In terms of single female poverty, the demographic groups most similar to Houma are Puerto Rican (34.1%, a difference of 0.92%), Tohono O'odham (34.2%, a difference of 1.2%), Lumbee (33.0%, a difference of 2.4%), Crow (32.4%, a difference of 4.3%), and Navajo (31.7%, a difference of 6.8%).
| Demographics | Rating | Rank | Single Female Poverty |
| Ute | 0.0 /100 | #333 | Tragic 28.4% |
| Pueblo | 0.0 /100 | #334 | Tragic 28.6% |
| Immigrants | Yemen | 0.0 /100 | #335 | Tragic 28.9% |
| Colville | 0.0 /100 | #336 | Tragic 29.1% |
| Yuman | 0.0 /100 | #337 | Tragic 29.4% |
| Pima | 0.0 /100 | #338 | Tragic 30.3% |
| Cheyenne | 0.0 /100 | #339 | Tragic 30.4% |
| Cajuns | 0.0 /100 | #340 | Tragic 30.6% |
| Sioux | 0.0 /100 | #341 | Tragic 31.3% |
| Navajo | 0.0 /100 | #342 | Tragic 31.7% |
| Crow | 0.0 /100 | #343 | Tragic 32.4% |
| Lumbee | 0.0 /100 | #344 | Tragic 33.0% |
| Houma | 0.0 /100 | #345 | Tragic 33.8% |
| Puerto Ricans | 0.0 /100 | #346 | Tragic 34.1% |
| Tohono O'odham | 0.0 /100 | #347 | Tragic 34.2% |
Demographics Similar to Immigrants from South Eastern Asia by Single Female Poverty
In terms of single female poverty, the demographic groups most similar to Immigrants from South Eastern Asia are Immigrants from Latvia (19.3%, a difference of 0.0%), Immigrants from Jordan (19.3%, a difference of 0.070%), Immigrants from Peru (19.3%, a difference of 0.10%), Immigrants from Belarus (19.3%, a difference of 0.12%), and Paraguayan (19.3%, a difference of 0.13%).
| Demographics | Rating | Rank | Single Female Poverty |
| Immigrants | Europe | 99.6 /100 | #64 | Exceptional 19.2% |
| Cypriots | 99.6 /100 | #65 | Exceptional 19.2% |
| Palestinians | 99.6 /100 | #66 | Exceptional 19.2% |
| Immigrants | Egypt | 99.6 /100 | #67 | Exceptional 19.2% |
| Laotians | 99.5 /100 | #68 | Exceptional 19.3% |
| Paraguayans | 99.5 /100 | #69 | Exceptional 19.3% |
| Immigrants | Jordan | 99.4 /100 | #70 | Exceptional 19.3% |
| Immigrants | South Eastern Asia | 99.4 /100 | #71 | Exceptional 19.3% |
| Immigrants | Latvia | 99.4 /100 | #72 | Exceptional 19.3% |
| Immigrants | Peru | 99.4 /100 | #73 | Exceptional 19.3% |
| Immigrants | Belarus | 99.4 /100 | #74 | Exceptional 19.3% |
| Immigrants | Turkey | 99.4 /100 | #75 | Exceptional 19.4% |
| Peruvians | 99.4 /100 | #76 | Exceptional 19.4% |
| Immigrants | Russia | 99.3 /100 | #77 | Exceptional 19.4% |
| Albanians | 99.3 /100 | #78 | Exceptional 19.4% |