Houma vs Immigrants from Senegal Single Female Poverty
COMPARE
Houma
Immigrants from Senegal
Single Female Poverty
Single Female Poverty Comparison
Houma
Immigrants from Senegal
33.8%
SINGLE FEMALE POVERTY
0.0/ 100
METRIC RATING
345th/ 347
METRIC RANK
23.2%
SINGLE FEMALE POVERTY
0.1/ 100
METRIC RATING
272nd/ 347
METRIC RANK
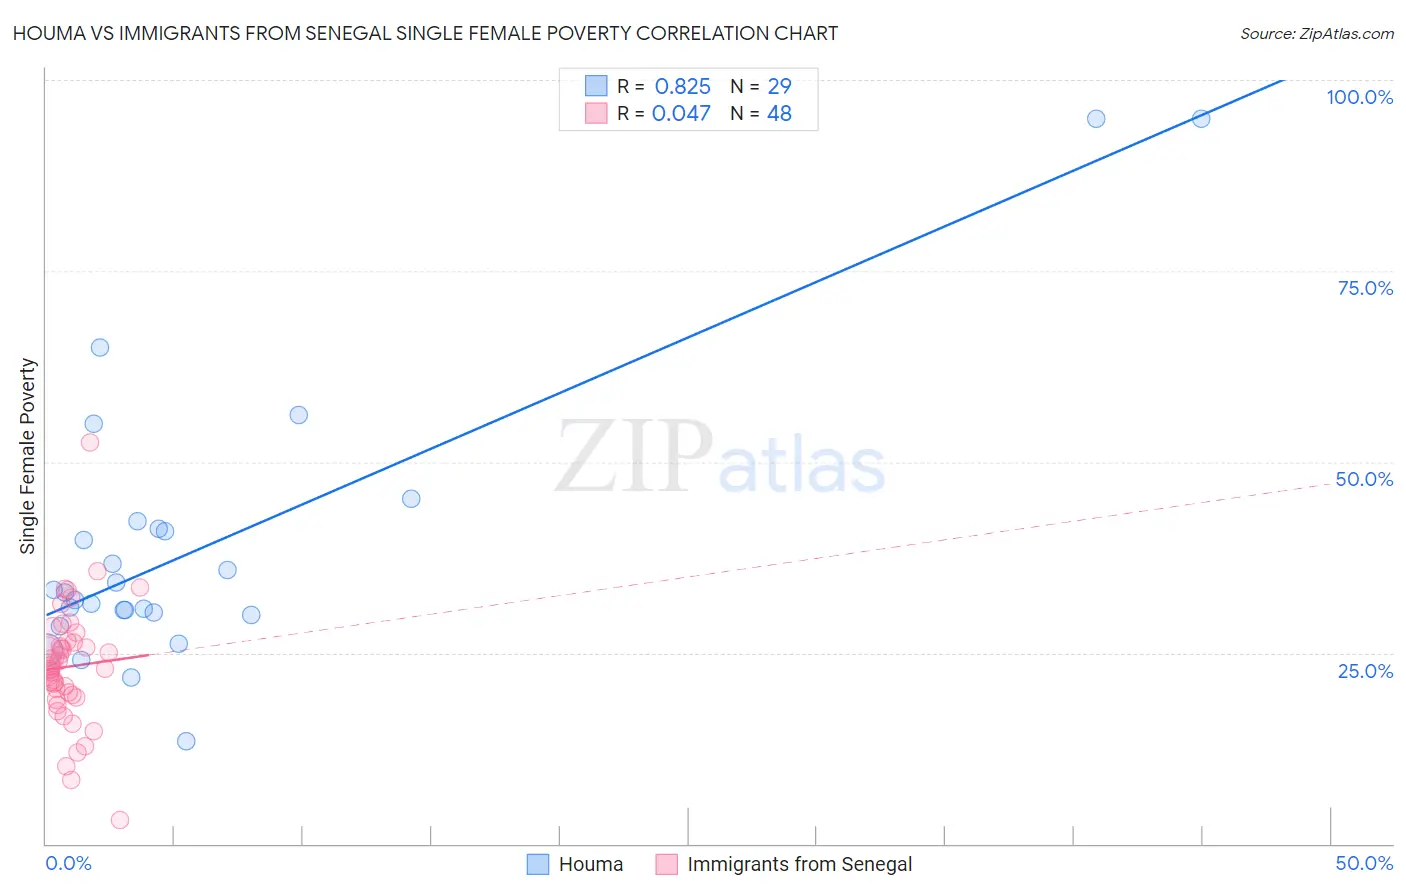
Houma vs Immigrants from Senegal Single Female Poverty Correlation Chart
The statistical analysis conducted on geographies consisting of 36,729,698 people shows a very strong positive correlation between the proportion of Houma and poverty level among single females in the United States with a correlation coefficient (R) of 0.825 and weighted average of 33.8%. Similarly, the statistical analysis conducted on geographies consisting of 89,958,915 people shows no correlation between the proportion of Immigrants from Senegal and poverty level among single females in the United States with a correlation coefficient (R) of 0.047 and weighted average of 23.2%, a difference of 45.5%.
Single Female Poverty Correlation Summary
| Measurement | Houma | Immigrants from Senegal |
| Minimum | 13.4% | 3.0% |
| Maximum | 94.8% | 52.6% |
| Range | 81.5% | 49.6% |
| Mean | 39.1% | 23.2% |
| Median | 33.0% | 23.1% |
| Interquartile 25% (IQ1) | 30.1% | 19.3% |
| Interquartile 75% (IQ3) | 41.8% | 26.4% |
| Interquartile Range (IQR) | 11.6% | 7.1% |
| Standard Deviation (Sample) | 18.7% | 8.0% |
| Standard Deviation (Population) | 18.4% | 7.9% |
Similar Demographics by Single Female Poverty
Demographics Similar to Houma by Single Female Poverty
In terms of single female poverty, the demographic groups most similar to Houma are Puerto Rican (34.1%, a difference of 0.92%), Tohono O'odham (34.2%, a difference of 1.2%), Lumbee (33.0%, a difference of 2.4%), Crow (32.4%, a difference of 4.3%), and Navajo (31.7%, a difference of 6.8%).
| Demographics | Rating | Rank | Single Female Poverty |
| Ute | 0.0 /100 | #333 | Tragic 28.4% |
| Pueblo | 0.0 /100 | #334 | Tragic 28.6% |
| Immigrants | Yemen | 0.0 /100 | #335 | Tragic 28.9% |
| Colville | 0.0 /100 | #336 | Tragic 29.1% |
| Yuman | 0.0 /100 | #337 | Tragic 29.4% |
| Pima | 0.0 /100 | #338 | Tragic 30.3% |
| Cheyenne | 0.0 /100 | #339 | Tragic 30.4% |
| Cajuns | 0.0 /100 | #340 | Tragic 30.6% |
| Sioux | 0.0 /100 | #341 | Tragic 31.3% |
| Navajo | 0.0 /100 | #342 | Tragic 31.7% |
| Crow | 0.0 /100 | #343 | Tragic 32.4% |
| Lumbee | 0.0 /100 | #344 | Tragic 33.0% |
| Houma | 0.0 /100 | #345 | Tragic 33.8% |
| Puerto Ricans | 0.0 /100 | #346 | Tragic 34.1% |
| Tohono O'odham | 0.0 /100 | #347 | Tragic 34.2% |
Demographics Similar to Immigrants from Senegal by Single Female Poverty
In terms of single female poverty, the demographic groups most similar to Immigrants from Senegal are Subsaharan African (23.2%, a difference of 0.19%), Alaska Native (23.3%, a difference of 0.25%), Marshallese (23.3%, a difference of 0.26%), Inupiat (23.1%, a difference of 0.43%), and Mexican American Indian (23.4%, a difference of 0.53%).
| Demographics | Rating | Rank | Single Female Poverty |
| Central Americans | 0.2 /100 | #265 | Tragic 23.0% |
| Immigrants | Micronesia | 0.2 /100 | #266 | Tragic 23.0% |
| Senegalese | 0.2 /100 | #267 | Tragic 23.0% |
| Fijians | 0.2 /100 | #268 | Tragic 23.1% |
| Hmong | 0.2 /100 | #269 | Tragic 23.1% |
| Inupiat | 0.2 /100 | #270 | Tragic 23.1% |
| Sub-Saharan Africans | 0.1 /100 | #271 | Tragic 23.2% |
| Immigrants | Senegal | 0.1 /100 | #272 | Tragic 23.2% |
| Alaska Natives | 0.1 /100 | #273 | Tragic 23.3% |
| Marshallese | 0.1 /100 | #274 | Tragic 23.3% |
| Mexican American Indians | 0.1 /100 | #275 | Tragic 23.4% |
| Immigrants | Azores | 0.0 /100 | #276 | Tragic 23.5% |
| Pennsylvania Germans | 0.0 /100 | #277 | Tragic 23.6% |
| Immigrants | Nonimmigrants | 0.0 /100 | #278 | Tragic 23.6% |
| Alaskan Athabascans | 0.0 /100 | #279 | Tragic 23.6% |