Houma vs Immigrants from Senegal Unemployment Among Women with Children Ages 6 to 17 years
COMPARE
Houma
Immigrants from Senegal
Unemployment Among Women with Children Ages 6 to 17 years
Unemployment Among Women with Children Ages 6 to 17 years Comparison
Houma
Immigrants from Senegal
12.5%
UNEMPLOYMENT AMONG WOMEN WITH CHILDREN AGES 6 TO 17 YEARS
0.0/ 100
METRIC RATING
336th/ 347
METRIC RANK
10.2%
UNEMPLOYMENT AMONG WOMEN WITH CHILDREN AGES 6 TO 17 YEARS
0.0/ 100
METRIC RATING
307th/ 347
METRIC RANK
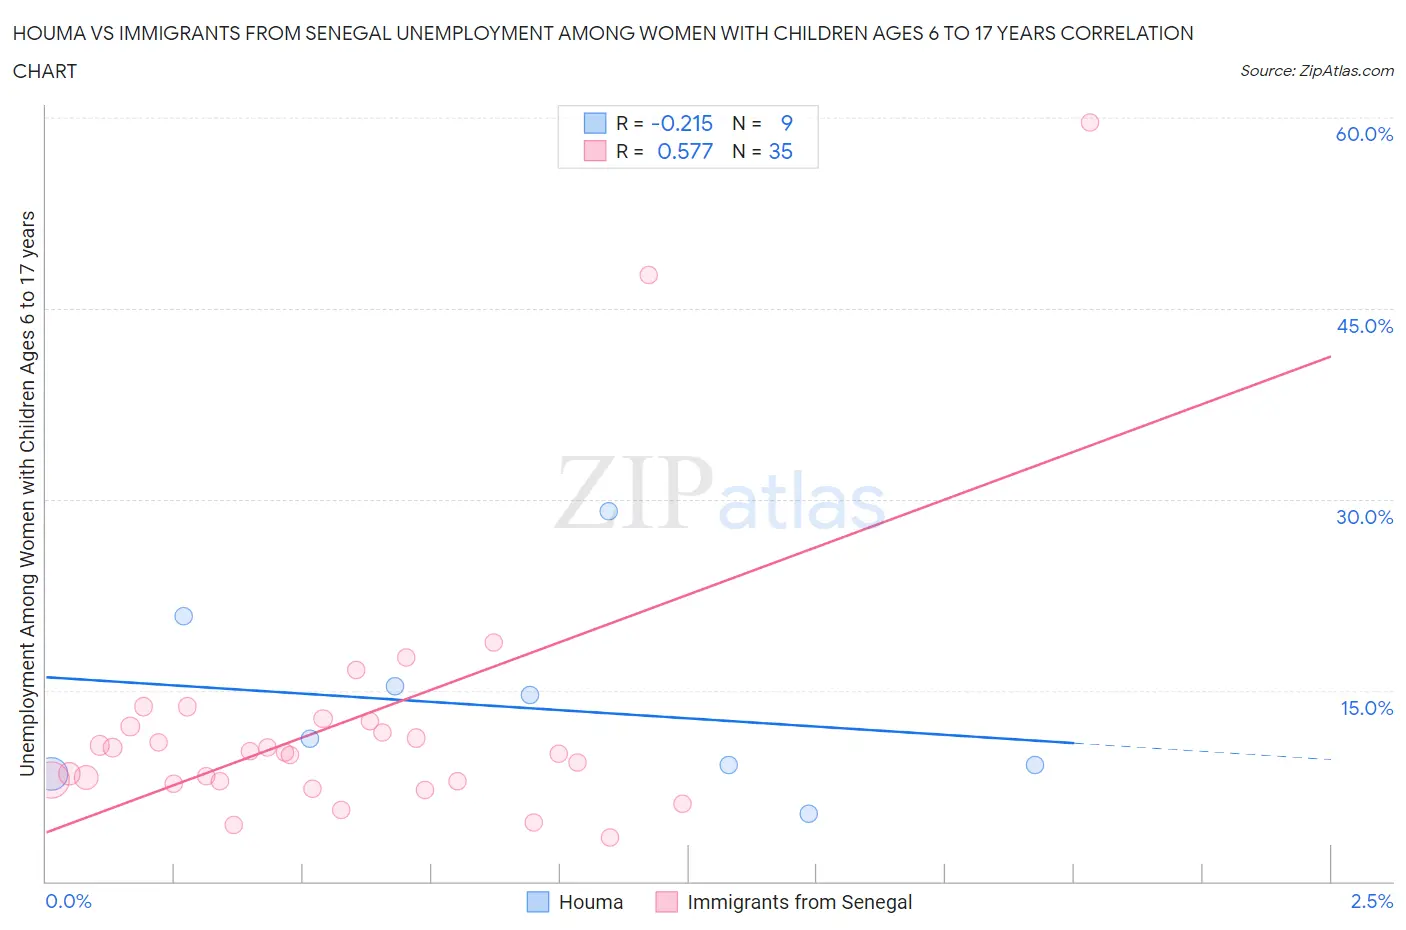
Houma vs Immigrants from Senegal Unemployment Among Women with Children Ages 6 to 17 years Correlation Chart
The statistical analysis conducted on geographies consisting of 33,838,816 people shows a weak negative correlation between the proportion of Houma and unemployment rate among women with children between the ages 6 and 17 in the United States with a correlation coefficient (R) of -0.215 and weighted average of 12.5%. Similarly, the statistical analysis conducted on geographies consisting of 80,966,607 people shows a substantial positive correlation between the proportion of Immigrants from Senegal and unemployment rate among women with children between the ages 6 and 17 in the United States with a correlation coefficient (R) of 0.577 and weighted average of 10.2%, a difference of 21.7%.
Unemployment Among Women with Children Ages 6 to 17 years Correlation Summary
| Measurement | Houma | Immigrants from Senegal |
| Minimum | 5.3% | 3.4% |
| Maximum | 29.1% | 59.6% |
| Range | 23.8% | 56.2% |
| Mean | 13.7% | 12.4% |
| Median | 11.2% | 10.1% |
| Interquartile 25% (IQ1) | 8.8% | 7.8% |
| Interquartile 75% (IQ3) | 18.1% | 12.5% |
| Interquartile Range (IQR) | 9.3% | 4.7% |
| Standard Deviation (Sample) | 7.4% | 11.0% |
| Standard Deviation (Population) | 7.0% | 10.8% |
Similar Demographics by Unemployment Among Women with Children Ages 6 to 17 years
Demographics Similar to Houma by Unemployment Among Women with Children Ages 6 to 17 years
In terms of unemployment among women with children ages 6 to 17 years, the demographic groups most similar to Houma are Colville (12.3%, a difference of 0.97%), Immigrants from Yemen (12.7%, a difference of 1.9%), Hopi (12.9%, a difference of 3.4%), Ugandan (12.0%, a difference of 3.7%), and Sioux (13.2%, a difference of 6.2%).
| Demographics | Rating | Rank | Unemployment Among Women with Children Ages 6 to 17 years |
| Pennsylvania Germans | 0.0 /100 | #329 | Tragic 11.0% |
| Chippewa | 0.0 /100 | #330 | Tragic 11.1% |
| Blacks/African Americans | 0.0 /100 | #331 | Tragic 11.4% |
| Tsimshian | 0.0 /100 | #332 | Tragic 11.4% |
| Natives/Alaskans | 0.0 /100 | #333 | Tragic 11.5% |
| Ugandans | 0.0 /100 | #334 | Tragic 12.0% |
| Colville | 0.0 /100 | #335 | Tragic 12.3% |
| Houma | 0.0 /100 | #336 | Tragic 12.5% |
| Immigrants | Yemen | 0.0 /100 | #337 | Tragic 12.7% |
| Hopi | 0.0 /100 | #338 | Tragic 12.9% |
| Sioux | 0.0 /100 | #339 | Tragic 13.2% |
| Puerto Ricans | 0.0 /100 | #340 | Tragic 13.9% |
| Navajo | 0.0 /100 | #341 | Tragic 14.2% |
| Yuman | 0.0 /100 | #342 | Tragic 14.8% |
| Inupiat | 0.0 /100 | #343 | Tragic 14.9% |
Demographics Similar to Immigrants from Senegal by Unemployment Among Women with Children Ages 6 to 17 years
In terms of unemployment among women with children ages 6 to 17 years, the demographic groups most similar to Immigrants from Senegal are Dutch West Indian (10.2%, a difference of 0.010%), Paraguayan (10.2%, a difference of 0.23%), Immigrants from Nigeria (10.2%, a difference of 0.52%), French Canadian (10.3%, a difference of 0.55%), and Immigrants from Venezuela (10.2%, a difference of 0.57%).
| Demographics | Rating | Rank | Unemployment Among Women with Children Ages 6 to 17 years |
| Nigerians | 0.0 /100 | #300 | Tragic 10.1% |
| Immigrants | Bahamas | 0.0 /100 | #301 | Tragic 10.1% |
| Venezuelans | 0.0 /100 | #302 | Tragic 10.2% |
| Immigrants | Ecuador | 0.0 /100 | #303 | Tragic 10.2% |
| Immigrants | Venezuela | 0.0 /100 | #304 | Tragic 10.2% |
| Immigrants | Nigeria | 0.0 /100 | #305 | Tragic 10.2% |
| Paraguayans | 0.0 /100 | #306 | Tragic 10.2% |
| Immigrants | Senegal | 0.0 /100 | #307 | Tragic 10.2% |
| Dutch West Indians | 0.0 /100 | #308 | Tragic 10.2% |
| French Canadians | 0.0 /100 | #309 | Tragic 10.3% |
| Alaska Natives | 0.0 /100 | #310 | Tragic 10.3% |
| Immigrants | Liberia | 0.0 /100 | #311 | Tragic 10.3% |
| Africans | 0.0 /100 | #312 | Tragic 10.4% |
| Americans | 0.0 /100 | #313 | Tragic 10.4% |
| Immigrants | Cabo Verde | 0.0 /100 | #314 | Tragic 10.4% |