Honduran vs Albanian Female Poverty
COMPARE
Honduran
Albanian
Female Poverty
Female Poverty Comparison
Hondurans
Albanians
17.4%
FEMALE POVERTY
0.0/ 100
METRIC RATING
316th/ 347
METRIC RANK
12.7%
FEMALE POVERTY
90.8/ 100
METRIC RATING
119th/ 347
METRIC RANK
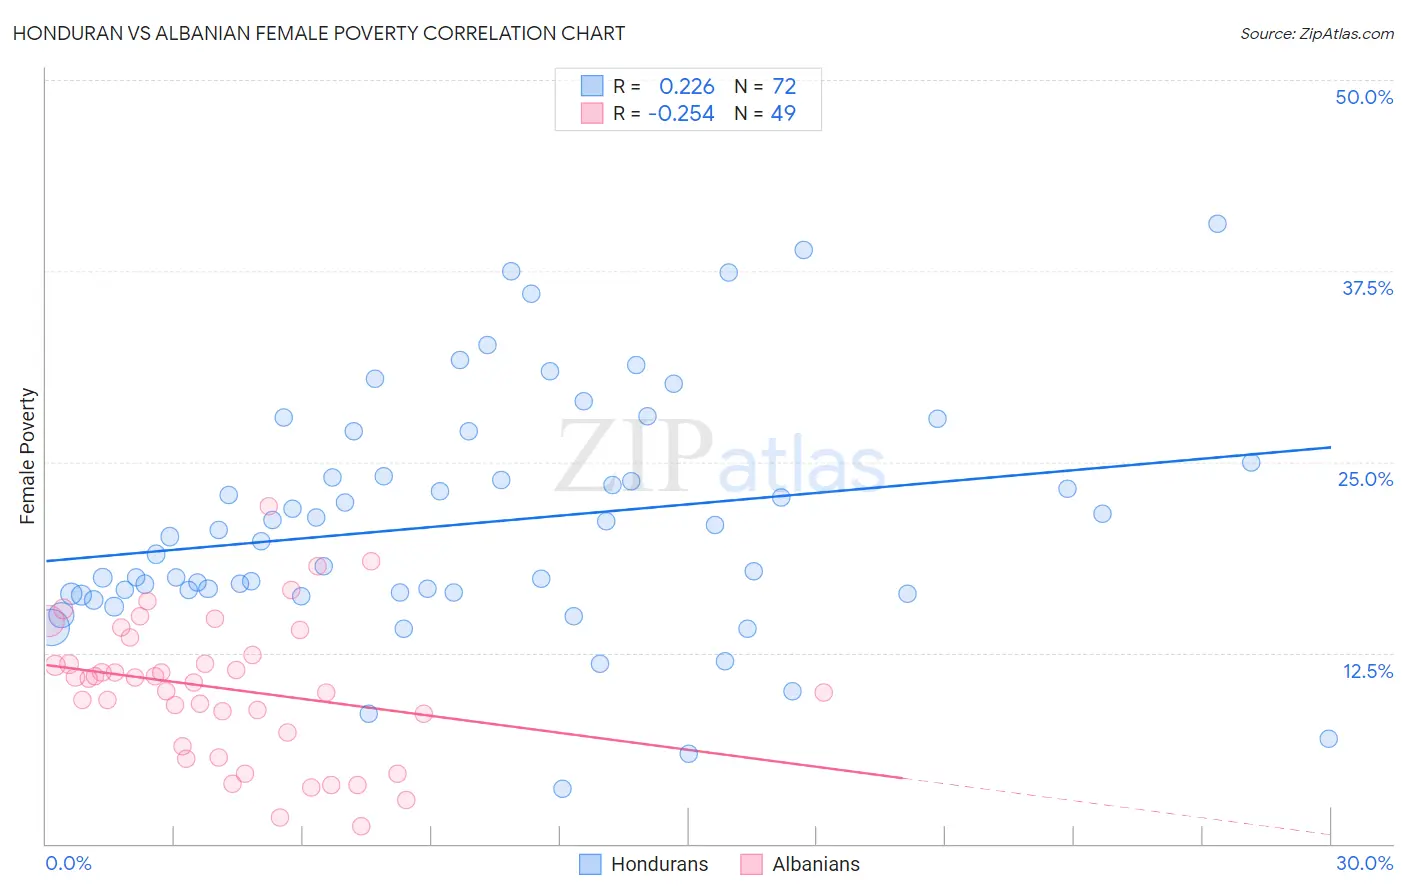
Honduran vs Albanian Female Poverty Correlation Chart
The statistical analysis conducted on geographies consisting of 357,544,045 people shows a weak positive correlation between the proportion of Hondurans and poverty level among females in the United States with a correlation coefficient (R) of 0.226 and weighted average of 17.4%. Similarly, the statistical analysis conducted on geographies consisting of 193,134,120 people shows a weak negative correlation between the proportion of Albanians and poverty level among females in the United States with a correlation coefficient (R) of -0.254 and weighted average of 12.7%, a difference of 36.7%.
Female Poverty Correlation Summary
| Measurement | Honduran | Albanian |
| Minimum | 3.6% | 1.2% |
| Maximum | 40.6% | 22.1% |
| Range | 37.0% | 20.9% |
| Mean | 21.0% | 10.2% |
| Median | 20.0% | 10.8% |
| Interquartile 25% (IQ1) | 16.4% | 6.8% |
| Interquartile 75% (IQ3) | 24.5% | 13.0% |
| Interquartile Range (IQR) | 8.1% | 6.1% |
| Standard Deviation (Sample) | 7.7% | 4.6% |
| Standard Deviation (Population) | 7.7% | 4.5% |
Similar Demographics by Female Poverty
Demographics Similar to Hondurans by Female Poverty
In terms of female poverty, the demographic groups most similar to Hondurans are Immigrants from Congo (17.4%, a difference of 0.19%), U.S. Virgin Islander (17.3%, a difference of 0.30%), Ute (17.5%, a difference of 0.52%), Cajun (17.5%, a difference of 0.53%), and Immigrants from Dominica (17.5%, a difference of 0.61%).
| Demographics | Rating | Rank | Female Poverty |
| Immigrants | Mexico | 0.0 /100 | #309 | Tragic 17.0% |
| Creek | 0.0 /100 | #310 | Tragic 17.0% |
| Immigrants | Guatemala | 0.0 /100 | #311 | Tragic 17.0% |
| Immigrants | Somalia | 0.0 /100 | #312 | Tragic 17.0% |
| British West Indians | 0.0 /100 | #313 | Tragic 17.0% |
| Dutch West Indians | 0.0 /100 | #314 | Tragic 17.1% |
| U.S. Virgin Islanders | 0.0 /100 | #315 | Tragic 17.3% |
| Hondurans | 0.0 /100 | #316 | Tragic 17.4% |
| Immigrants | Congo | 0.0 /100 | #317 | Tragic 17.4% |
| Ute | 0.0 /100 | #318 | Tragic 17.5% |
| Cajuns | 0.0 /100 | #319 | Tragic 17.5% |
| Immigrants | Dominica | 0.0 /100 | #320 | Tragic 17.5% |
| Arapaho | 0.0 /100 | #321 | Tragic 17.5% |
| Menominee | 0.0 /100 | #322 | Tragic 17.6% |
| Paiute | 0.0 /100 | #323 | Tragic 17.7% |
Demographics Similar to Albanians by Female Poverty
In terms of female poverty, the demographic groups most similar to Albanians are Sri Lankan (12.7%, a difference of 0.010%), Immigrants from Southern Europe (12.7%, a difference of 0.030%), New Zealander (12.7%, a difference of 0.060%), Immigrants from Russia (12.7%, a difference of 0.10%), and Immigrants from Hungary (12.7%, a difference of 0.16%).
| Demographics | Rating | Rank | Female Poverty |
| Immigrants | Israel | 92.0 /100 | #112 | Exceptional 12.6% |
| Canadians | 92.0 /100 | #113 | Exceptional 12.7% |
| Welsh | 91.6 /100 | #114 | Exceptional 12.7% |
| Puget Sound Salish | 91.5 /100 | #115 | Exceptional 12.7% |
| Immigrants | Russia | 91.2 /100 | #116 | Exceptional 12.7% |
| Immigrants | Southern Europe | 90.9 /100 | #117 | Exceptional 12.7% |
| Sri Lankans | 90.9 /100 | #118 | Exceptional 12.7% |
| Albanians | 90.8 /100 | #119 | Exceptional 12.7% |
| New Zealanders | 90.6 /100 | #120 | Exceptional 12.7% |
| Immigrants | Hungary | 90.3 /100 | #121 | Exceptional 12.7% |
| French Canadians | 90.2 /100 | #122 | Exceptional 12.7% |
| Immigrants | South Eastern Asia | 89.9 /100 | #123 | Excellent 12.7% |
| Immigrants | Norway | 89.3 /100 | #124 | Excellent 12.8% |
| Argentineans | 89.1 /100 | #125 | Excellent 12.8% |
| Immigrants | Ukraine | 88.8 /100 | #126 | Excellent 12.8% |