Honduran vs Immigrants from Vietnam Unemployment
COMPARE
Honduran
Immigrants from Vietnam
Unemployment
Unemployment Comparison
Hondurans
Immigrants from Vietnam
5.7%
UNEMPLOYMENT
0.3/ 100
METRIC RATING
252nd/ 347
METRIC RANK
5.2%
UNEMPLOYMENT
52.5/ 100
METRIC RATING
172nd/ 347
METRIC RANK
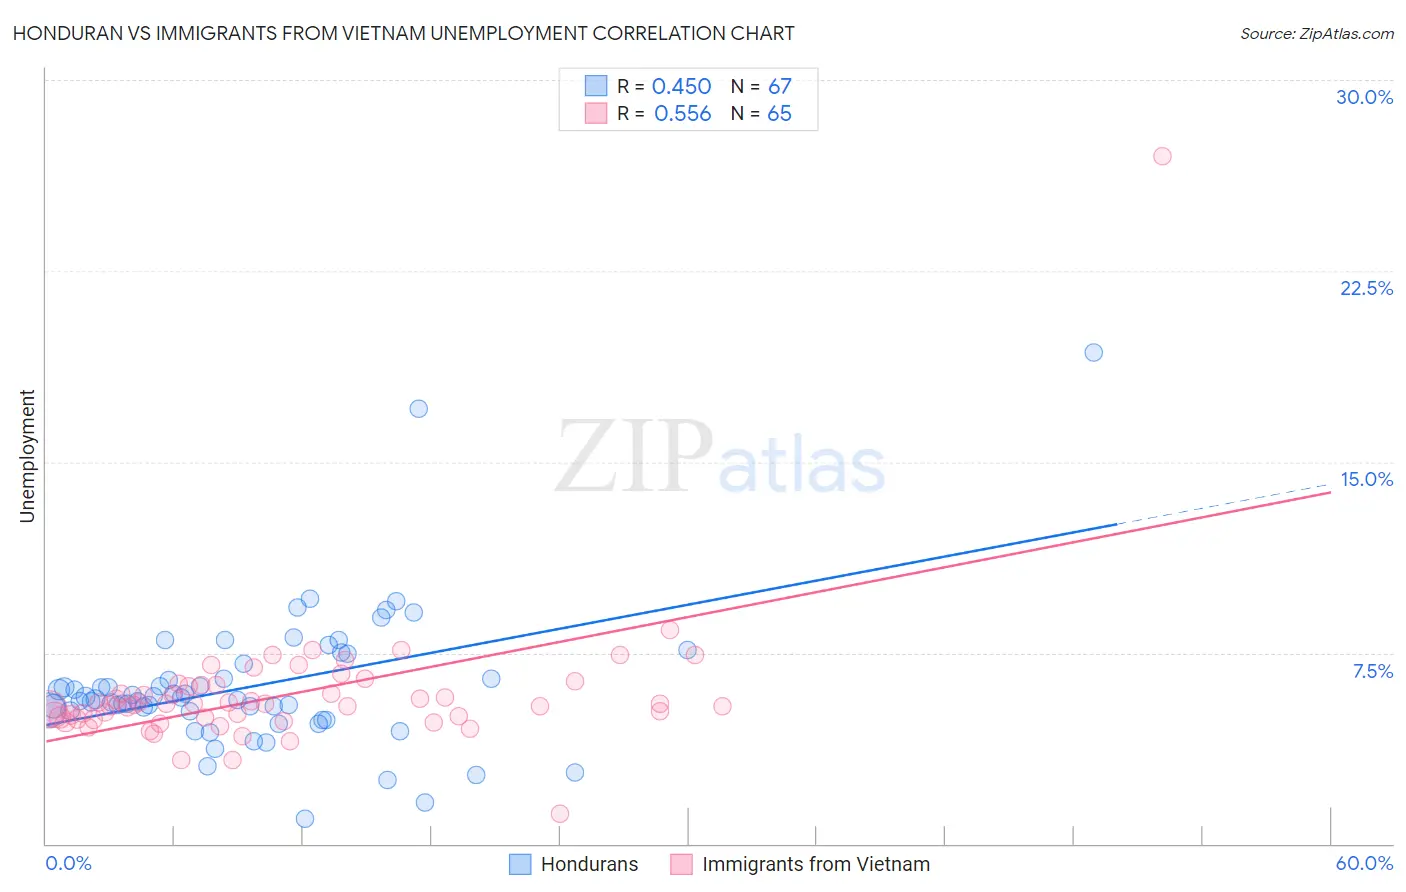
Honduran vs Immigrants from Vietnam Unemployment Correlation Chart
The statistical analysis conducted on geographies consisting of 357,563,016 people shows a moderate positive correlation between the proportion of Hondurans and unemployment in the United States with a correlation coefficient (R) of 0.450 and weighted average of 5.7%. Similarly, the statistical analysis conducted on geographies consisting of 404,504,928 people shows a substantial positive correlation between the proportion of Immigrants from Vietnam and unemployment in the United States with a correlation coefficient (R) of 0.556 and weighted average of 5.2%, a difference of 8.9%.
Unemployment Correlation Summary
| Measurement | Honduran | Immigrants from Vietnam |
| Minimum | 1.0% | 1.2% |
| Maximum | 19.3% | 27.0% |
| Range | 18.3% | 25.8% |
| Mean | 6.2% | 5.9% |
| Median | 5.7% | 5.5% |
| Interquartile 25% (IQ1) | 5.2% | 4.9% |
| Interquartile 75% (IQ3) | 7.1% | 6.2% |
| Interquartile Range (IQR) | 1.9% | 1.3% |
| Standard Deviation (Sample) | 2.8% | 2.9% |
| Standard Deviation (Population) | 2.8% | 2.9% |
Similar Demographics by Unemployment
Demographics Similar to Hondurans by Unemployment
In terms of unemployment, the demographic groups most similar to Hondurans are Central American (5.7%, a difference of 0.010%), Immigrants from Honduras (5.7%, a difference of 0.080%), Immigrants from Portugal (5.7%, a difference of 0.53%), Kiowa (5.7%, a difference of 0.74%), and Guatemalan (5.8%, a difference of 0.74%).
| Demographics | Rating | Rank | Unemployment |
| French American Indians | 1.2 /100 | #245 | Tragic 5.6% |
| Bermudans | 1.1 /100 | #246 | Tragic 5.6% |
| Immigrants | Cameroon | 1.0 /100 | #247 | Tragic 5.6% |
| Liberians | 0.9 /100 | #248 | Tragic 5.6% |
| Cajuns | 0.8 /100 | #249 | Tragic 5.6% |
| Japanese | 0.8 /100 | #250 | Tragic 5.6% |
| Kiowa | 0.6 /100 | #251 | Tragic 5.7% |
| Hondurans | 0.3 /100 | #252 | Tragic 5.7% |
| Central Americans | 0.3 /100 | #253 | Tragic 5.7% |
| Immigrants | Honduras | 0.3 /100 | #254 | Tragic 5.7% |
| Immigrants | Portugal | 0.2 /100 | #255 | Tragic 5.7% |
| Guatemalans | 0.2 /100 | #256 | Tragic 5.8% |
| Yaqui | 0.2 /100 | #257 | Tragic 5.8% |
| Immigrants | Bahamas | 0.1 /100 | #258 | Tragic 5.8% |
| Sub-Saharan Africans | 0.1 /100 | #259 | Tragic 5.8% |
Demographics Similar to Immigrants from Vietnam by Unemployment
In terms of unemployment, the demographic groups most similar to Immigrants from Vietnam are Immigrants from Poland (5.3%, a difference of 0.040%), Immigrants from Congo (5.3%, a difference of 0.15%), Taiwanese (5.3%, a difference of 0.18%), Nicaraguan (5.3%, a difference of 0.24%), and Puget Sound Salish (5.2%, a difference of 0.25%).
| Demographics | Rating | Rank | Unemployment |
| Immigrants | Brazil | 63.1 /100 | #165 | Good 5.2% |
| Immigrants | Indonesia | 61.2 /100 | #166 | Good 5.2% |
| Colombians | 61.1 /100 | #167 | Good 5.2% |
| Uruguayans | 60.2 /100 | #168 | Good 5.2% |
| Immigrants | Morocco | 59.1 /100 | #169 | Average 5.2% |
| Immigrants | Nicaragua | 57.1 /100 | #170 | Average 5.2% |
| Puget Sound Salish | 56.6 /100 | #171 | Average 5.2% |
| Immigrants | Vietnam | 52.5 /100 | #172 | Average 5.2% |
| Immigrants | Poland | 51.8 /100 | #173 | Average 5.3% |
| Immigrants | Congo | 50.0 /100 | #174 | Average 5.3% |
| Taiwanese | 49.6 /100 | #175 | Average 5.3% |
| Nicaraguans | 48.7 /100 | #176 | Average 5.3% |
| Immigrants | Nonimmigrants | 47.9 /100 | #177 | Average 5.3% |
| Afghans | 47.4 /100 | #178 | Average 5.3% |
| Malaysians | 46.8 /100 | #179 | Average 5.3% |