Honduran vs Immigrants from St. Vincent and the Grenadines Female Poverty
COMPARE
Honduran
Immigrants from St. Vincent and the Grenadines
Female Poverty
Female Poverty Comparison
Hondurans
Immigrants from St. Vincent and the Grenadines
17.4%
FEMALE POVERTY
0.0/ 100
METRIC RATING
316th/ 347
METRIC RANK
15.9%
FEMALE POVERTY
0.0/ 100
METRIC RATING
271st/ 347
METRIC RANK
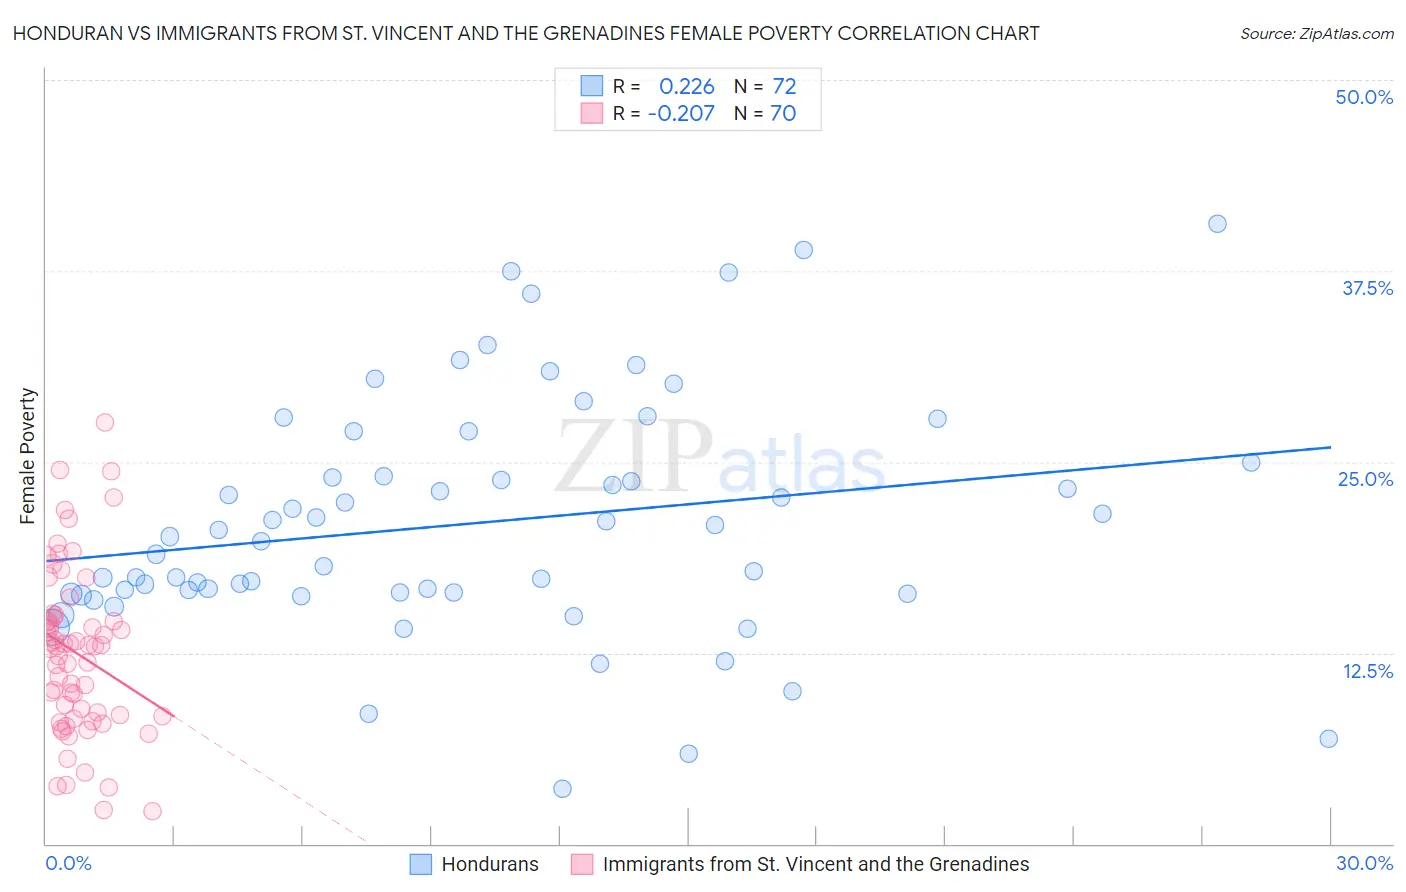
Honduran vs Immigrants from St. Vincent and the Grenadines Female Poverty Correlation Chart
The statistical analysis conducted on geographies consisting of 357,544,045 people shows a weak positive correlation between the proportion of Hondurans and poverty level among females in the United States with a correlation coefficient (R) of 0.226 and weighted average of 17.4%. Similarly, the statistical analysis conducted on geographies consisting of 56,090,975 people shows a weak negative correlation between the proportion of Immigrants from St. Vincent and the Grenadines and poverty level among females in the United States with a correlation coefficient (R) of -0.207 and weighted average of 15.9%, a difference of 9.2%.
Female Poverty Correlation Summary
| Measurement | Honduran | Immigrants from St. Vincent and the Grenadines |
| Minimum | 3.6% | 2.1% |
| Maximum | 40.6% | 27.6% |
| Range | 37.0% | 25.5% |
| Mean | 21.0% | 12.5% |
| Median | 20.0% | 13.0% |
| Interquartile 25% (IQ1) | 16.4% | 8.3% |
| Interquartile 75% (IQ3) | 24.5% | 14.8% |
| Interquartile Range (IQR) | 8.1% | 6.5% |
| Standard Deviation (Sample) | 7.7% | 5.4% |
| Standard Deviation (Population) | 7.7% | 5.4% |
Similar Demographics by Female Poverty
Demographics Similar to Hondurans by Female Poverty
In terms of female poverty, the demographic groups most similar to Hondurans are Immigrants from Congo (17.4%, a difference of 0.19%), U.S. Virgin Islander (17.3%, a difference of 0.30%), Ute (17.5%, a difference of 0.52%), Cajun (17.5%, a difference of 0.53%), and Immigrants from Dominica (17.5%, a difference of 0.61%).
| Demographics | Rating | Rank | Female Poverty |
| Immigrants | Mexico | 0.0 /100 | #309 | Tragic 17.0% |
| Creek | 0.0 /100 | #310 | Tragic 17.0% |
| Immigrants | Guatemala | 0.0 /100 | #311 | Tragic 17.0% |
| Immigrants | Somalia | 0.0 /100 | #312 | Tragic 17.0% |
| British West Indians | 0.0 /100 | #313 | Tragic 17.0% |
| Dutch West Indians | 0.0 /100 | #314 | Tragic 17.1% |
| U.S. Virgin Islanders | 0.0 /100 | #315 | Tragic 17.3% |
| Hondurans | 0.0 /100 | #316 | Tragic 17.4% |
| Immigrants | Congo | 0.0 /100 | #317 | Tragic 17.4% |
| Ute | 0.0 /100 | #318 | Tragic 17.5% |
| Cajuns | 0.0 /100 | #319 | Tragic 17.5% |
| Immigrants | Dominica | 0.0 /100 | #320 | Tragic 17.5% |
| Arapaho | 0.0 /100 | #321 | Tragic 17.5% |
| Menominee | 0.0 /100 | #322 | Tragic 17.6% |
| Paiute | 0.0 /100 | #323 | Tragic 17.7% |
Demographics Similar to Immigrants from St. Vincent and the Grenadines by Female Poverty
In terms of female poverty, the demographic groups most similar to Immigrants from St. Vincent and the Grenadines are Belizean (15.9%, a difference of 0.23%), Haitian (15.9%, a difference of 0.23%), Barbadian (15.9%, a difference of 0.24%), Chickasaw (15.9%, a difference of 0.28%), and Immigrants from Barbados (16.0%, a difference of 0.30%).
| Demographics | Rating | Rank | Female Poverty |
| Immigrants | Ecuador | 0.1 /100 | #264 | Tragic 15.6% |
| Immigrants | Liberia | 0.1 /100 | #265 | Tragic 15.7% |
| Immigrants | El Salvador | 0.1 /100 | #266 | Tragic 15.7% |
| Sub-Saharan Africans | 0.1 /100 | #267 | Tragic 15.8% |
| Immigrants | Nicaragua | 0.1 /100 | #268 | Tragic 15.8% |
| Iroquois | 0.1 /100 | #269 | Tragic 15.8% |
| Chickasaw | 0.1 /100 | #270 | Tragic 15.9% |
| Immigrants | St. Vincent and the Grenadines | 0.0 /100 | #271 | Tragic 15.9% |
| Belizeans | 0.0 /100 | #272 | Tragic 15.9% |
| Haitians | 0.0 /100 | #273 | Tragic 15.9% |
| Barbadians | 0.0 /100 | #274 | Tragic 15.9% |
| Immigrants | Barbados | 0.0 /100 | #275 | Tragic 16.0% |
| Central Americans | 0.0 /100 | #276 | Tragic 16.0% |
| Bangladeshis | 0.0 /100 | #277 | Tragic 16.0% |
| Immigrants | West Indies | 0.0 /100 | #278 | Tragic 16.1% |