Honduran vs Immigrants from Vietnam Householder Income Ages 25 - 44 years
COMPARE
Honduran
Immigrants from Vietnam
Householder Income Ages 25 - 44 years
Householder Income Ages 25 - 44 years Comparison
Hondurans
Immigrants from Vietnam
$78,540
HOUSEHOLDER INCOME AGES 25 - 44 YEARS
0.0/ 100
METRIC RATING
319th/ 347
METRIC RANK
$100,535
HOUSEHOLDER INCOME AGES 25 - 44 YEARS
96.5/ 100
METRIC RATING
105th/ 347
METRIC RANK
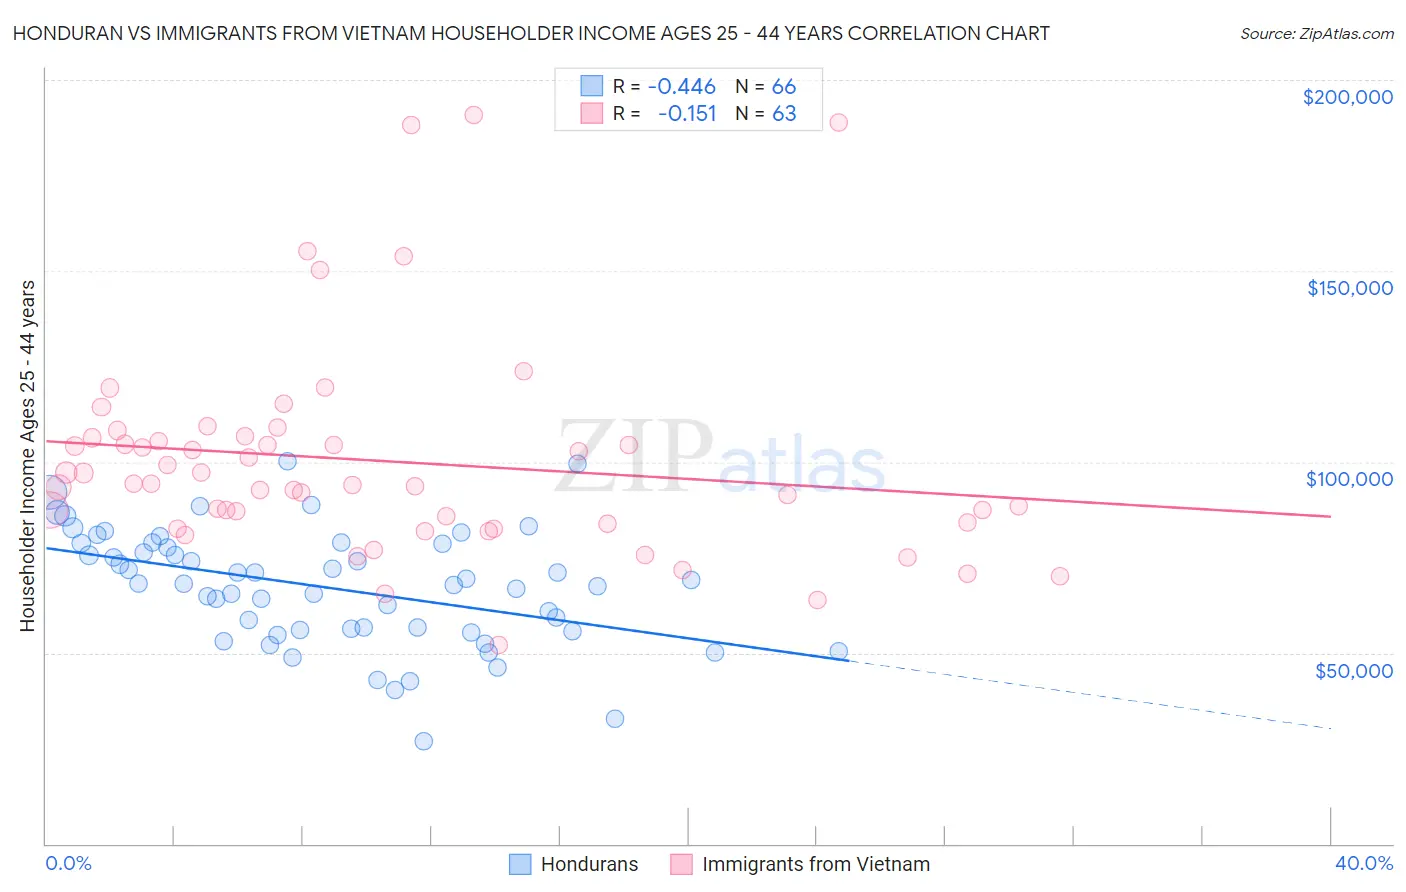
Honduran vs Immigrants from Vietnam Householder Income Ages 25 - 44 years Correlation Chart
The statistical analysis conducted on geographies consisting of 357,079,818 people shows a moderate negative correlation between the proportion of Hondurans and household income with householder between the ages 25 and 44 in the United States with a correlation coefficient (R) of -0.446 and weighted average of $78,540. Similarly, the statistical analysis conducted on geographies consisting of 403,588,460 people shows a poor negative correlation between the proportion of Immigrants from Vietnam and household income with householder between the ages 25 and 44 in the United States with a correlation coefficient (R) of -0.151 and weighted average of $100,535, a difference of 28.0%.
Householder Income Ages 25 - 44 years Correlation Summary
| Measurement | Honduran | Immigrants from Vietnam |
| Minimum | $26,956 | $51,884 |
| Maximum | $100,173 | $190,804 |
| Range | $73,217 | $138,920 |
| Mean | $67,051 | $100,184 |
| Median | $68,041 | $94,148 |
| Interquartile 25% (IQ1) | $56,015 | $83,833 |
| Interquartile 75% (IQ3) | $78,438 | $106,342 |
| Interquartile Range (IQR) | $22,423 | $22,509 |
| Standard Deviation (Sample) | $15,191 | $27,886 |
| Standard Deviation (Population) | $15,075 | $27,664 |
Similar Demographics by Householder Income Ages 25 - 44 years
Demographics Similar to Hondurans by Householder Income Ages 25 - 44 years
In terms of householder income ages 25 - 44 years, the demographic groups most similar to Hondurans are Immigrants from Mexico ($78,809, a difference of 0.34%), U.S. Virgin Islander ($78,911, a difference of 0.47%), Choctaw ($78,168, a difference of 0.48%), African ($78,986, a difference of 0.57%), and Ottawa ($79,012, a difference of 0.60%).
| Demographics | Rating | Rank | Householder Income Ages 25 - 44 years |
| Immigrants | Haiti | 0.0 /100 | #312 | Tragic $79,391 |
| Menominee | 0.0 /100 | #313 | Tragic $79,358 |
| Cheyenne | 0.0 /100 | #314 | Tragic $79,152 |
| Ottawa | 0.0 /100 | #315 | Tragic $79,012 |
| Africans | 0.0 /100 | #316 | Tragic $78,986 |
| U.S. Virgin Islanders | 0.0 /100 | #317 | Tragic $78,911 |
| Immigrants | Mexico | 0.0 /100 | #318 | Tragic $78,809 |
| Hondurans | 0.0 /100 | #319 | Tragic $78,540 |
| Choctaw | 0.0 /100 | #320 | Tragic $78,168 |
| Immigrants | Zaire | 0.0 /100 | #321 | Tragic $78,045 |
| Chickasaw | 0.0 /100 | #322 | Tragic $77,929 |
| Immigrants | Honduras | 0.0 /100 | #323 | Tragic $77,328 |
| Dutch West Indians | 0.0 /100 | #324 | Tragic $77,260 |
| Sioux | 0.0 /100 | #325 | Tragic $77,089 |
| Houma | 0.0 /100 | #326 | Tragic $77,044 |
Demographics Similar to Immigrants from Vietnam by Householder Income Ages 25 - 44 years
In terms of householder income ages 25 - 44 years, the demographic groups most similar to Immigrants from Vietnam are Immigrants from Brazil ($100,534, a difference of 0.0%), Northern European ($100,457, a difference of 0.080%), Immigrants from South Eastern Asia ($100,283, a difference of 0.25%), Immigrants from North Macedonia ($100,101, a difference of 0.43%), and Immigrants from Poland ($101,065, a difference of 0.53%).
| Demographics | Rating | Rank | Householder Income Ages 25 - 44 years |
| Immigrants | Kazakhstan | 98.1 /100 | #98 | Exceptional $101,727 |
| Taiwanese | 97.9 /100 | #99 | Exceptional $101,492 |
| Immigrants | Argentina | 97.8 /100 | #100 | Exceptional $101,415 |
| Albanians | 97.8 /100 | #101 | Exceptional $101,367 |
| Immigrants | Lebanon | 97.4 /100 | #102 | Exceptional $101,124 |
| Immigrants | Moldova | 97.4 /100 | #103 | Exceptional $101,091 |
| Immigrants | Poland | 97.4 /100 | #104 | Exceptional $101,065 |
| Immigrants | Vietnam | 96.5 /100 | #105 | Exceptional $100,535 |
| Immigrants | Brazil | 96.5 /100 | #106 | Exceptional $100,534 |
| Northern Europeans | 96.3 /100 | #107 | Exceptional $100,457 |
| Immigrants | South Eastern Asia | 96.0 /100 | #108 | Exceptional $100,283 |
| Immigrants | North Macedonia | 95.6 /100 | #109 | Exceptional $100,101 |
| Immigrants | Afghanistan | 95.3 /100 | #110 | Exceptional $99,977 |
| Chileans | 95.1 /100 | #111 | Exceptional $99,900 |
| Poles | 94.5 /100 | #112 | Exceptional $99,685 |