Hmong vs Black/African American Single Mother Poverty
COMPARE
Hmong
Black/African American
Single Mother Poverty
Single Mother Poverty Comparison
Hmong
Blacks/African Americans
31.2%
SINGLE MOTHER POVERTY
0.3/ 100
METRIC RATING
262nd/ 347
METRIC RANK
35.2%
SINGLE MOTHER POVERTY
0.0/ 100
METRIC RATING
322nd/ 347
METRIC RANK
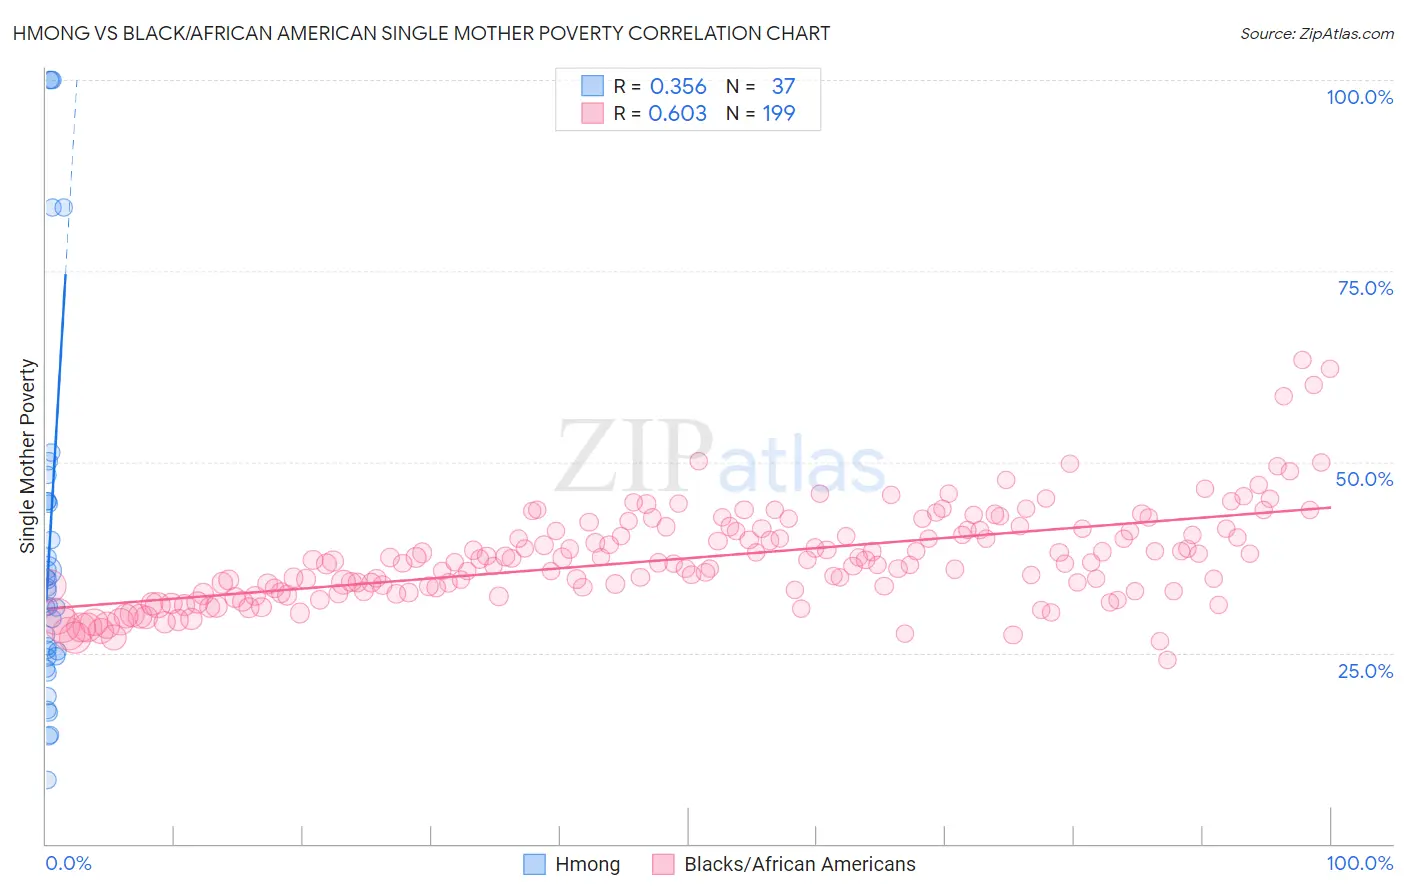
Hmong vs Black/African American Single Mother Poverty Correlation Chart
The statistical analysis conducted on geographies consisting of 24,640,250 people shows a mild positive correlation between the proportion of Hmong and poverty level among single mothers in the United States with a correlation coefficient (R) of 0.356 and weighted average of 31.2%. Similarly, the statistical analysis conducted on geographies consisting of 541,579,434 people shows a significant positive correlation between the proportion of Blacks/African Americans and poverty level among single mothers in the United States with a correlation coefficient (R) of 0.603 and weighted average of 35.2%, a difference of 12.7%.
Single Mother Poverty Correlation Summary
| Measurement | Hmong | Black/African American |
| Minimum | 8.4% | 24.1% |
| Maximum | 100.0% | 63.3% |
| Range | 91.6% | 39.2% |
| Mean | 39.1% | 37.4% |
| Median | 33.2% | 36.8% |
| Interquartile 25% (IQ1) | 24.5% | 33.1% |
| Interquartile 75% (IQ3) | 44.8% | 41.1% |
| Interquartile Range (IQR) | 20.3% | 8.0% |
| Standard Deviation (Sample) | 24.2% | 6.3% |
| Standard Deviation (Population) | 23.9% | 6.3% |
Similar Demographics by Single Mother Poverty
Demographics Similar to Hmong by Single Mother Poverty
In terms of single mother poverty, the demographic groups most similar to Hmong are Immigrants from El Salvador (31.2%, a difference of 0.14%), White/Caucasian (31.2%, a difference of 0.21%), Bahamian (31.3%, a difference of 0.27%), Immigrants from Ecuador (31.3%, a difference of 0.28%), and German Russian (31.3%, a difference of 0.31%).
| Demographics | Rating | Rank | Single Mother Poverty |
| Belizeans | 0.5 /100 | #255 | Tragic 31.0% |
| Immigrants | West Indies | 0.4 /100 | #256 | Tragic 31.1% |
| Immigrants | Bahamas | 0.4 /100 | #257 | Tragic 31.1% |
| Immigrants | Caribbean | 0.4 /100 | #258 | Tragic 31.1% |
| Immigrants | Bangladesh | 0.4 /100 | #259 | Tragic 31.1% |
| Whites/Caucasians | 0.3 /100 | #260 | Tragic 31.2% |
| Immigrants | El Salvador | 0.3 /100 | #261 | Tragic 31.2% |
| Hmong | 0.3 /100 | #262 | Tragic 31.2% |
| Bahamians | 0.2 /100 | #263 | Tragic 31.3% |
| Immigrants | Ecuador | 0.2 /100 | #264 | Tragic 31.3% |
| German Russians | 0.2 /100 | #265 | Tragic 31.3% |
| Sub-Saharan Africans | 0.2 /100 | #266 | Tragic 31.4% |
| Immigrants | Belize | 0.2 /100 | #267 | Tragic 31.4% |
| Immigrants | Senegal | 0.1 /100 | #268 | Tragic 31.5% |
| Scotch-Irish | 0.1 /100 | #269 | Tragic 31.5% |
Demographics Similar to Blacks/African Americans by Single Mother Poverty
In terms of single mother poverty, the demographic groups most similar to Blacks/African Americans are Paiute (35.1%, a difference of 0.20%), Kiowa (35.5%, a difference of 0.71%), Ottawa (35.5%, a difference of 0.92%), Iroquois (34.8%, a difference of 1.1%), and Chippewa (34.8%, a difference of 1.3%).
| Demographics | Rating | Rank | Single Mother Poverty |
| Hopi | 0.0 /100 | #315 | Tragic 34.5% |
| Dominicans | 0.0 /100 | #316 | Tragic 34.5% |
| Cherokee | 0.0 /100 | #317 | Tragic 34.5% |
| Immigrants | Honduras | 0.0 /100 | #318 | Tragic 34.7% |
| Chippewa | 0.0 /100 | #319 | Tragic 34.8% |
| Iroquois | 0.0 /100 | #320 | Tragic 34.8% |
| Paiute | 0.0 /100 | #321 | Tragic 35.1% |
| Blacks/African Americans | 0.0 /100 | #322 | Tragic 35.2% |
| Kiowa | 0.0 /100 | #323 | Tragic 35.5% |
| Ottawa | 0.0 /100 | #324 | Tragic 35.5% |
| Ute | 0.0 /100 | #325 | Tragic 35.7% |
| Seminole | 0.0 /100 | #326 | Tragic 35.8% |
| Yakama | 0.0 /100 | #327 | Tragic 36.4% |
| Choctaw | 0.0 /100 | #328 | Tragic 36.4% |
| Apache | 0.0 /100 | #329 | Tragic 36.6% |