Hmong vs Immigrants from Bosnia and Herzegovina Single Mother Poverty
COMPARE
Hmong
Immigrants from Bosnia and Herzegovina
Single Mother Poverty
Single Mother Poverty Comparison
Hmong
Immigrants from Bosnia and Herzegovina
31.2%
SINGLE MOTHER POVERTY
0.3/ 100
METRIC RATING
262nd/ 347
METRIC RANK
29.2%
SINGLE MOTHER POVERTY
45.1/ 100
METRIC RATING
177th/ 347
METRIC RANK
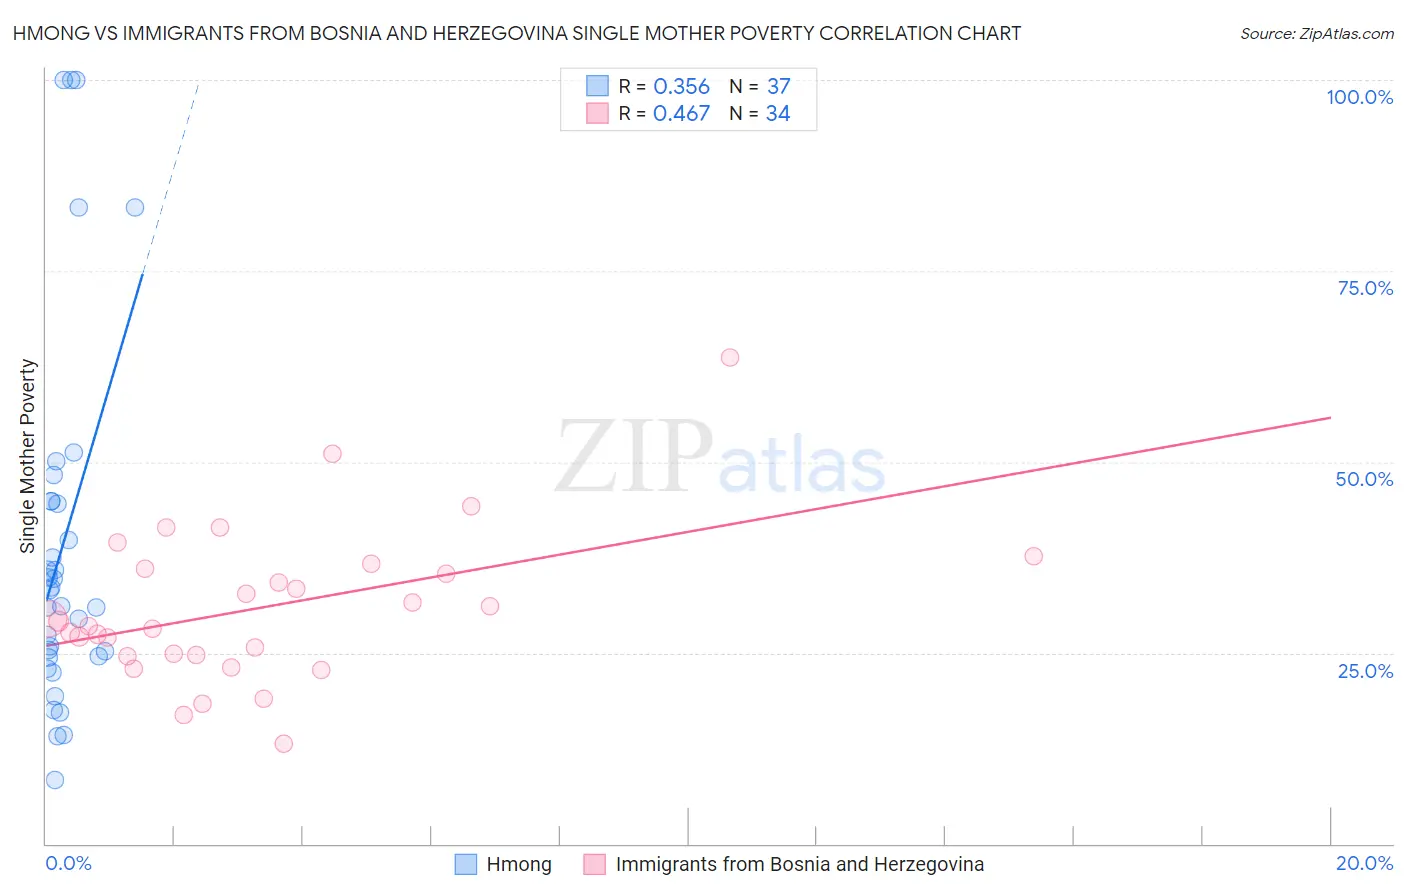
Hmong vs Immigrants from Bosnia and Herzegovina Single Mother Poverty Correlation Chart
The statistical analysis conducted on geographies consisting of 24,640,250 people shows a mild positive correlation between the proportion of Hmong and poverty level among single mothers in the United States with a correlation coefficient (R) of 0.356 and weighted average of 31.2%. Similarly, the statistical analysis conducted on geographies consisting of 155,194,459 people shows a moderate positive correlation between the proportion of Immigrants from Bosnia and Herzegovina and poverty level among single mothers in the United States with a correlation coefficient (R) of 0.467 and weighted average of 29.2%, a difference of 6.9%.
Single Mother Poverty Correlation Summary
| Measurement | Hmong | Immigrants from Bosnia and Herzegovina |
| Minimum | 8.4% | 13.0% |
| Maximum | 100.0% | 63.6% |
| Range | 91.6% | 50.6% |
| Mean | 39.1% | 30.9% |
| Median | 33.2% | 28.8% |
| Interquartile 25% (IQ1) | 24.5% | 24.7% |
| Interquartile 75% (IQ3) | 44.8% | 35.9% |
| Interquartile Range (IQR) | 20.3% | 11.2% |
| Standard Deviation (Sample) | 24.2% | 10.0% |
| Standard Deviation (Population) | 23.9% | 9.9% |
Similar Demographics by Single Mother Poverty
Demographics Similar to Hmong by Single Mother Poverty
In terms of single mother poverty, the demographic groups most similar to Hmong are Immigrants from El Salvador (31.2%, a difference of 0.14%), White/Caucasian (31.2%, a difference of 0.21%), Bahamian (31.3%, a difference of 0.27%), Immigrants from Ecuador (31.3%, a difference of 0.28%), and German Russian (31.3%, a difference of 0.31%).
| Demographics | Rating | Rank | Single Mother Poverty |
| Belizeans | 0.5 /100 | #255 | Tragic 31.0% |
| Immigrants | West Indies | 0.4 /100 | #256 | Tragic 31.1% |
| Immigrants | Bahamas | 0.4 /100 | #257 | Tragic 31.1% |
| Immigrants | Caribbean | 0.4 /100 | #258 | Tragic 31.1% |
| Immigrants | Bangladesh | 0.4 /100 | #259 | Tragic 31.1% |
| Whites/Caucasians | 0.3 /100 | #260 | Tragic 31.2% |
| Immigrants | El Salvador | 0.3 /100 | #261 | Tragic 31.2% |
| Hmong | 0.3 /100 | #262 | Tragic 31.2% |
| Bahamians | 0.2 /100 | #263 | Tragic 31.3% |
| Immigrants | Ecuador | 0.2 /100 | #264 | Tragic 31.3% |
| German Russians | 0.2 /100 | #265 | Tragic 31.3% |
| Sub-Saharan Africans | 0.2 /100 | #266 | Tragic 31.4% |
| Immigrants | Belize | 0.2 /100 | #267 | Tragic 31.4% |
| Immigrants | Senegal | 0.1 /100 | #268 | Tragic 31.5% |
| Scotch-Irish | 0.1 /100 | #269 | Tragic 31.5% |
Demographics Similar to Immigrants from Bosnia and Herzegovina by Single Mother Poverty
In terms of single mother poverty, the demographic groups most similar to Immigrants from Bosnia and Herzegovina are South American Indian (29.3%, a difference of 0.090%), Immigrants from Uzbekistan (29.3%, a difference of 0.12%), Hawaiian (29.2%, a difference of 0.13%), Immigrants from Costa Rica (29.2%, a difference of 0.17%), and Immigrants from Norway (29.3%, a difference of 0.18%).
| Demographics | Rating | Rank | Single Mother Poverty |
| New Zealanders | 55.1 /100 | #170 | Average 29.1% |
| Puget Sound Salish | 55.1 /100 | #171 | Average 29.1% |
| Carpatho Rusyns | 53.8 /100 | #172 | Average 29.1% |
| British | 50.6 /100 | #173 | Average 29.2% |
| Immigrants | Saudi Arabia | 50.0 /100 | #174 | Average 29.2% |
| Immigrants | Costa Rica | 48.8 /100 | #175 | Average 29.2% |
| Hawaiians | 47.8 /100 | #176 | Average 29.2% |
| Immigrants | Bosnia and Herzegovina | 45.1 /100 | #177 | Average 29.2% |
| South American Indians | 43.2 /100 | #178 | Average 29.3% |
| Immigrants | Uzbekistan | 42.6 /100 | #179 | Average 29.3% |
| Immigrants | Norway | 41.5 /100 | #180 | Average 29.3% |
| Canadians | 40.4 /100 | #181 | Average 29.3% |
| Immigrants | Eastern Africa | 38.5 /100 | #182 | Fair 29.3% |
| Nepalese | 38.3 /100 | #183 | Fair 29.3% |
| Nigerians | 38.0 /100 | #184 | Fair 29.3% |