Hmong vs Fijian Householder Income Under 25 years
COMPARE
Hmong
Fijian
Householder Income Under 25 years
Householder Income Under 25 years Comparison
Hmong
Fijians
$49,364
HOUSEHOLDER INCOME UNDER 25 YEARS
0.1/ 100
METRIC RATING
280th/ 347
METRIC RANK
$50,132
HOUSEHOLDER INCOME UNDER 25 YEARS
0.6/ 100
METRIC RATING
264th/ 347
METRIC RANK
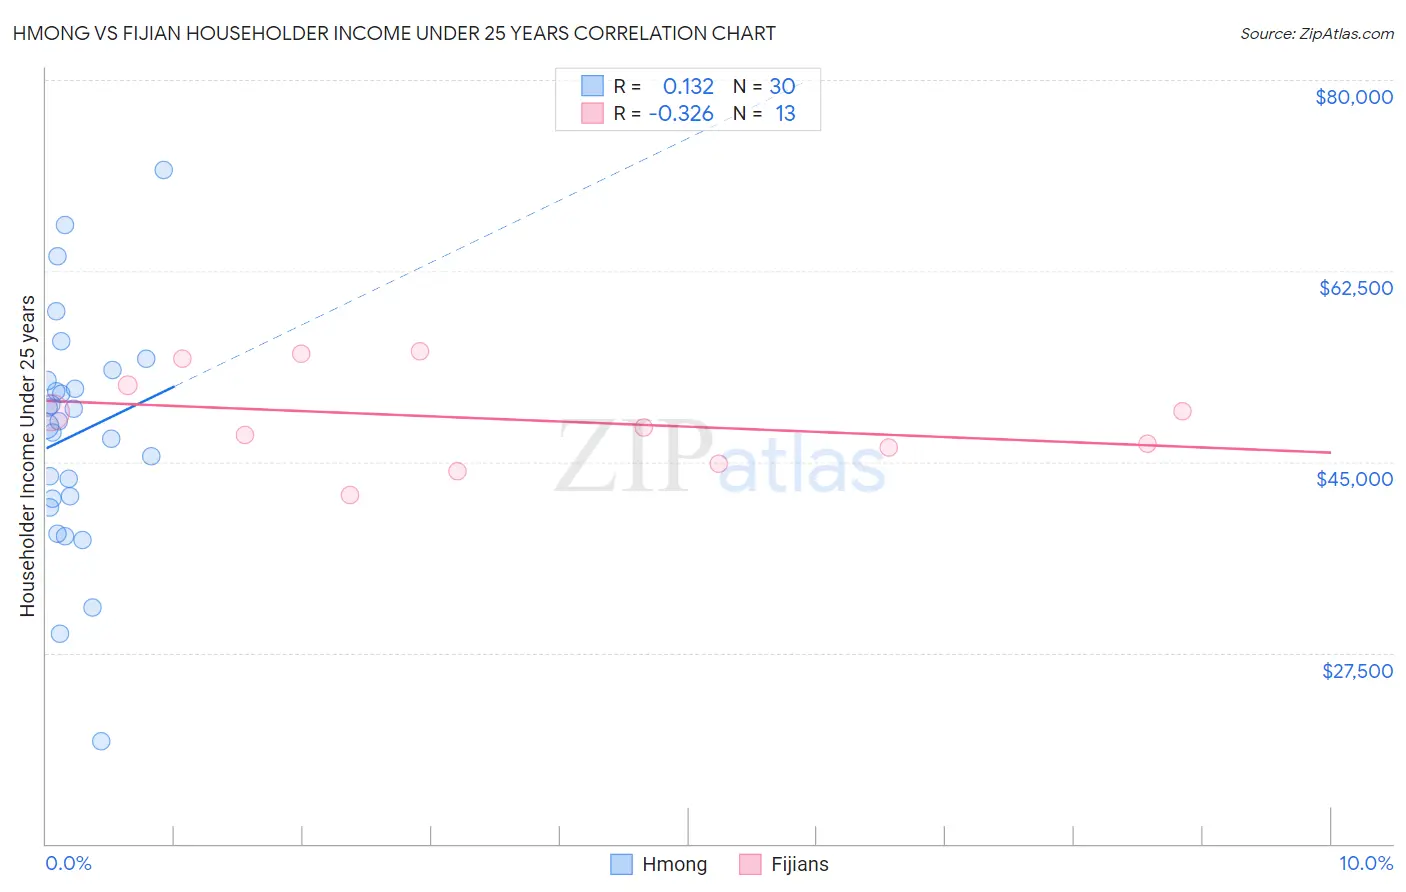
Hmong vs Fijian Householder Income Under 25 years Correlation Chart
The statistical analysis conducted on geographies consisting of 24,241,082 people shows a poor positive correlation between the proportion of Hmong and household income with householder under the age of 25 in the United States with a correlation coefficient (R) of 0.132 and weighted average of $49,364. Similarly, the statistical analysis conducted on geographies consisting of 53,807,935 people shows a mild negative correlation between the proportion of Fijians and household income with householder under the age of 25 in the United States with a correlation coefficient (R) of -0.326 and weighted average of $50,132, a difference of 1.6%.
Householder Income Under 25 years Correlation Summary
| Measurement | Hmong | Fijian |
| Minimum | $19,375 | $42,002 |
| Maximum | $71,711 | $55,154 |
| Range | $52,336 | $13,151 |
| Mean | $47,504 | $48,862 |
| Median | $48,507 | $48,154 |
| Interquartile 25% (IQ1) | $41,574 | $45,561 |
| Interquartile 75% (IQ3) | $52,449 | $53,230 |
| Interquartile Range (IQR) | $10,875 | $7,669 |
| Standard Deviation (Sample) | $10,797 | $4,254 |
| Standard Deviation (Population) | $10,616 | $4,087 |
Demographics Similar to Hmong and Fijians by Householder Income Under 25 years
In terms of householder income under 25 years, the demographic groups most similar to Hmong are Nonimmigrants ($49,348, a difference of 0.030%), Apache ($49,395, a difference of 0.060%), Nigerian ($49,416, a difference of 0.11%), Alsatian ($49,267, a difference of 0.20%), and Immigrants from Western Africa ($49,621, a difference of 0.52%). Similarly, the demographic groups most similar to Fijians are Belgian ($50,113, a difference of 0.040%), Immigrants from Venezuela ($50,109, a difference of 0.050%), Immigrants from Dominican Republic ($50,204, a difference of 0.14%), Immigrants from Laos ($50,041, a difference of 0.18%), and Haitian ($50,231, a difference of 0.20%).
| Demographics | Rating | Rank | Householder Income Under 25 years |
| Haitians | 0.8 /100 | #262 | Tragic $50,231 |
| Immigrants | Dominican Republic | 0.8 /100 | #263 | Tragic $50,204 |
| Fijians | 0.6 /100 | #264 | Tragic $50,132 |
| Belgians | 0.6 /100 | #265 | Tragic $50,113 |
| Immigrants | Venezuela | 0.6 /100 | #266 | Tragic $50,109 |
| Immigrants | Laos | 0.5 /100 | #267 | Tragic $50,041 |
| Venezuelans | 0.5 /100 | #268 | Tragic $50,011 |
| Ute | 0.5 /100 | #269 | Tragic $49,997 |
| Mexicans | 0.5 /100 | #270 | Tragic $49,989 |
| Taiwanese | 0.3 /100 | #271 | Tragic $49,804 |
| Colville | 0.3 /100 | #272 | Tragic $49,774 |
| Slovaks | 0.3 /100 | #273 | Tragic $49,753 |
| Immigrants | Senegal | 0.3 /100 | #274 | Tragic $49,742 |
| Immigrants | Kenya | 0.2 /100 | #275 | Tragic $49,633 |
| Dominicans | 0.2 /100 | #276 | Tragic $49,633 |
| Immigrants | Western Africa | 0.2 /100 | #277 | Tragic $49,621 |
| Nigerians | 0.1 /100 | #278 | Tragic $49,416 |
| Apache | 0.1 /100 | #279 | Tragic $49,395 |
| Hmong | 0.1 /100 | #280 | Tragic $49,364 |
| Immigrants | Nonimmigrants | 0.1 /100 | #281 | Tragic $49,348 |
| Alsatians | 0.1 /100 | #282 | Tragic $49,267 |