Hmong vs Crow Currently Married
COMPARE
Hmong
Crow
Currently Married
Currently Married Comparison
Hmong
Crow
47.1%
CURRENTLY MARRIED
73.4/ 100
METRIC RATING
144th/ 347
METRIC RANK
40.4%
CURRENTLY MARRIED
0.0/ 100
METRIC RATING
329th/ 347
METRIC RANK
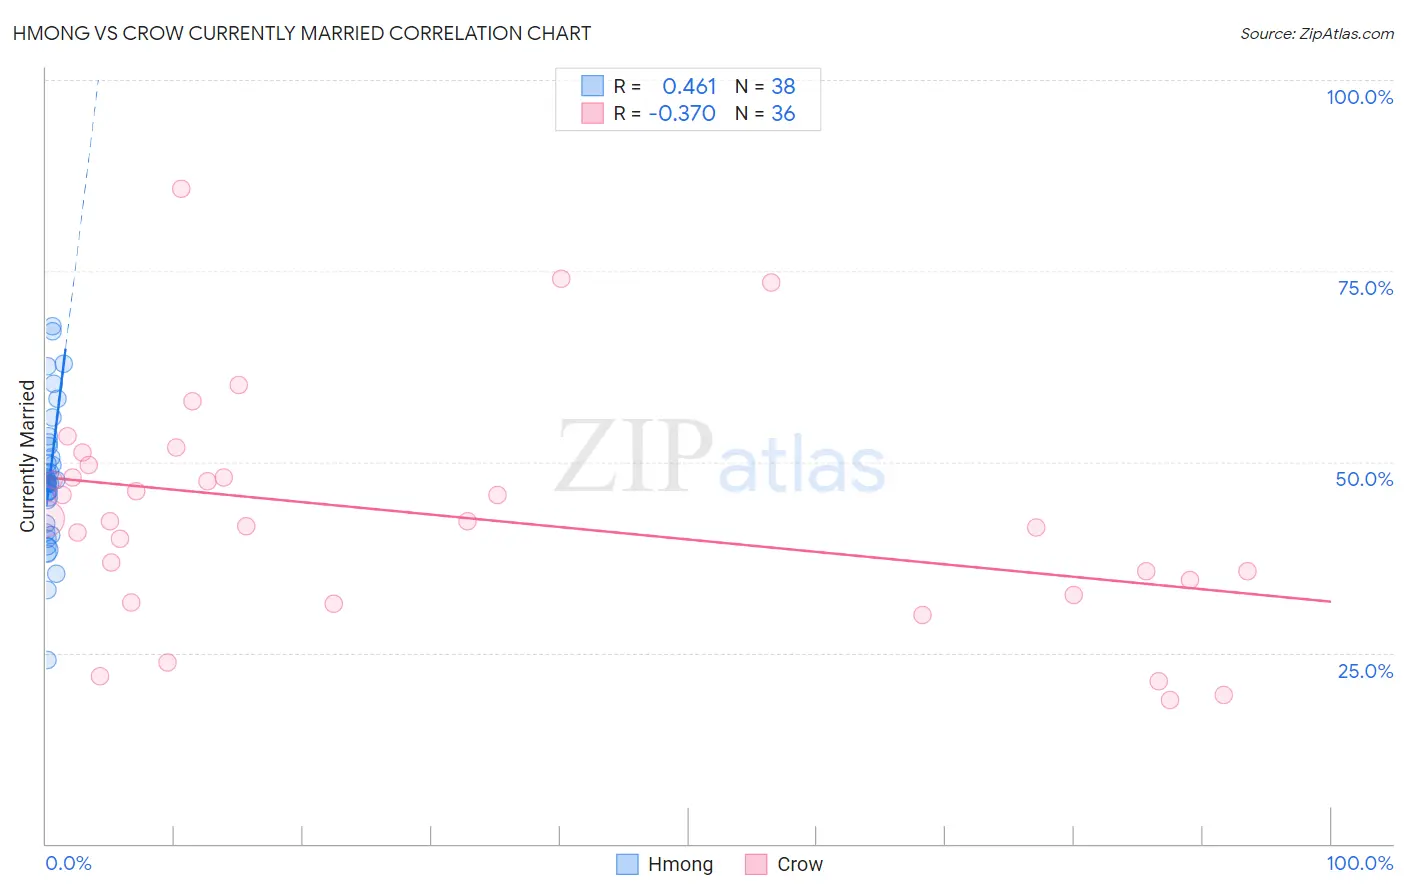
Hmong vs Crow Currently Married Correlation Chart
The statistical analysis conducted on geographies consisting of 24,669,739 people shows a moderate positive correlation between the proportion of Hmong and percentage of population currently married in the United States with a correlation coefficient (R) of 0.461 and weighted average of 47.1%. Similarly, the statistical analysis conducted on geographies consisting of 59,208,662 people shows a mild negative correlation between the proportion of Crow and percentage of population currently married in the United States with a correlation coefficient (R) of -0.370 and weighted average of 40.4%, a difference of 16.6%.
Currently Married Correlation Summary
| Measurement | Hmong | Crow |
| Minimum | 24.0% | 18.8% |
| Maximum | 67.8% | 85.8% |
| Range | 43.8% | 67.0% |
| Mean | 47.9% | 43.0% |
| Median | 47.4% | 42.2% |
| Interquartile 25% (IQ1) | 42.0% | 33.5% |
| Interquartile 75% (IQ3) | 52.0% | 48.8% |
| Interquartile Range (IQR) | 10.0% | 15.3% |
| Standard Deviation (Sample) | 9.1% | 15.0% |
| Standard Deviation (Population) | 9.0% | 14.8% |
Similar Demographics by Currently Married
Demographics Similar to Hmong by Currently Married
In terms of currently married, the demographic groups most similar to Hmong are Immigrants from South Eastern Asia (47.1%, a difference of 0.030%), Argentinean (47.1%, a difference of 0.040%), Guamanian/Chamorro (47.1%, a difference of 0.040%), Carpatho Rusyn (47.0%, a difference of 0.040%), and Venezuelan (47.1%, a difference of 0.050%).
| Demographics | Rating | Rank | Currently Married |
| Paraguayans | 77.8 /100 | #137 | Good 47.2% |
| Pakistanis | 77.5 /100 | #138 | Good 47.2% |
| Yugoslavians | 77.4 /100 | #139 | Good 47.2% |
| Cajuns | 75.3 /100 | #140 | Good 47.1% |
| Venezuelans | 74.4 /100 | #141 | Good 47.1% |
| Argentineans | 74.4 /100 | #142 | Good 47.1% |
| Guamanians/Chamorros | 74.2 /100 | #143 | Good 47.1% |
| Hmong | 73.4 /100 | #144 | Good 47.1% |
| Immigrants | South Eastern Asia | 72.9 /100 | #145 | Good 47.1% |
| Carpatho Rusyns | 72.6 /100 | #146 | Good 47.0% |
| Immigrants | Argentina | 72.0 /100 | #147 | Good 47.0% |
| Cambodians | 70.4 /100 | #148 | Good 47.0% |
| Zimbabweans | 70.1 /100 | #149 | Good 47.0% |
| Immigrants | Turkey | 70.0 /100 | #150 | Good 47.0% |
| Chileans | 69.8 /100 | #151 | Good 47.0% |
Demographics Similar to Crow by Currently Married
In terms of currently married, the demographic groups most similar to Crow are Immigrants from Dominica (40.3%, a difference of 0.090%), Immigrants from Barbados (40.3%, a difference of 0.10%), Arapaho (40.5%, a difference of 0.43%), Senegalese (40.6%, a difference of 0.47%), and Barbadian (40.6%, a difference of 0.65%).
| Demographics | Rating | Rank | Currently Married |
| Immigrants | Haiti | 0.0 /100 | #322 | Tragic 41.0% |
| Immigrants | West Indies | 0.0 /100 | #323 | Tragic 40.7% |
| Immigrants | Senegal | 0.0 /100 | #324 | Tragic 40.7% |
| U.S. Virgin Islanders | 0.0 /100 | #325 | Tragic 40.7% |
| Barbadians | 0.0 /100 | #326 | Tragic 40.6% |
| Senegalese | 0.0 /100 | #327 | Tragic 40.6% |
| Arapaho | 0.0 /100 | #328 | Tragic 40.5% |
| Crow | 0.0 /100 | #329 | Tragic 40.4% |
| Immigrants | Dominica | 0.0 /100 | #330 | Tragic 40.3% |
| Immigrants | Barbados | 0.0 /100 | #331 | Tragic 40.3% |
| Immigrants | St. Vincent and the Grenadines | 0.0 /100 | #332 | Tragic 40.1% |
| Yup'ik | 0.0 /100 | #333 | Tragic 39.9% |
| Puerto Ricans | 0.0 /100 | #334 | Tragic 39.9% |
| Lumbee | 0.0 /100 | #335 | Tragic 39.8% |
| British West Indians | 0.0 /100 | #336 | Tragic 39.8% |