Hispanic or Latino vs Spanish American Disability Age Under 5
COMPARE
Hispanic or Latino
Spanish American
Disability Age Under 5
Disability Age Under 5 Comparison
Hispanics or Latinos
Spanish Americans
1.3%
DISABILITY AGE UNDER 5
7.7/ 100
METRIC RATING
223rd/ 347
METRIC RANK
1.1%
DISABILITY AGE UNDER 5
96.9/ 100
METRIC RATING
93rd/ 347
METRIC RANK
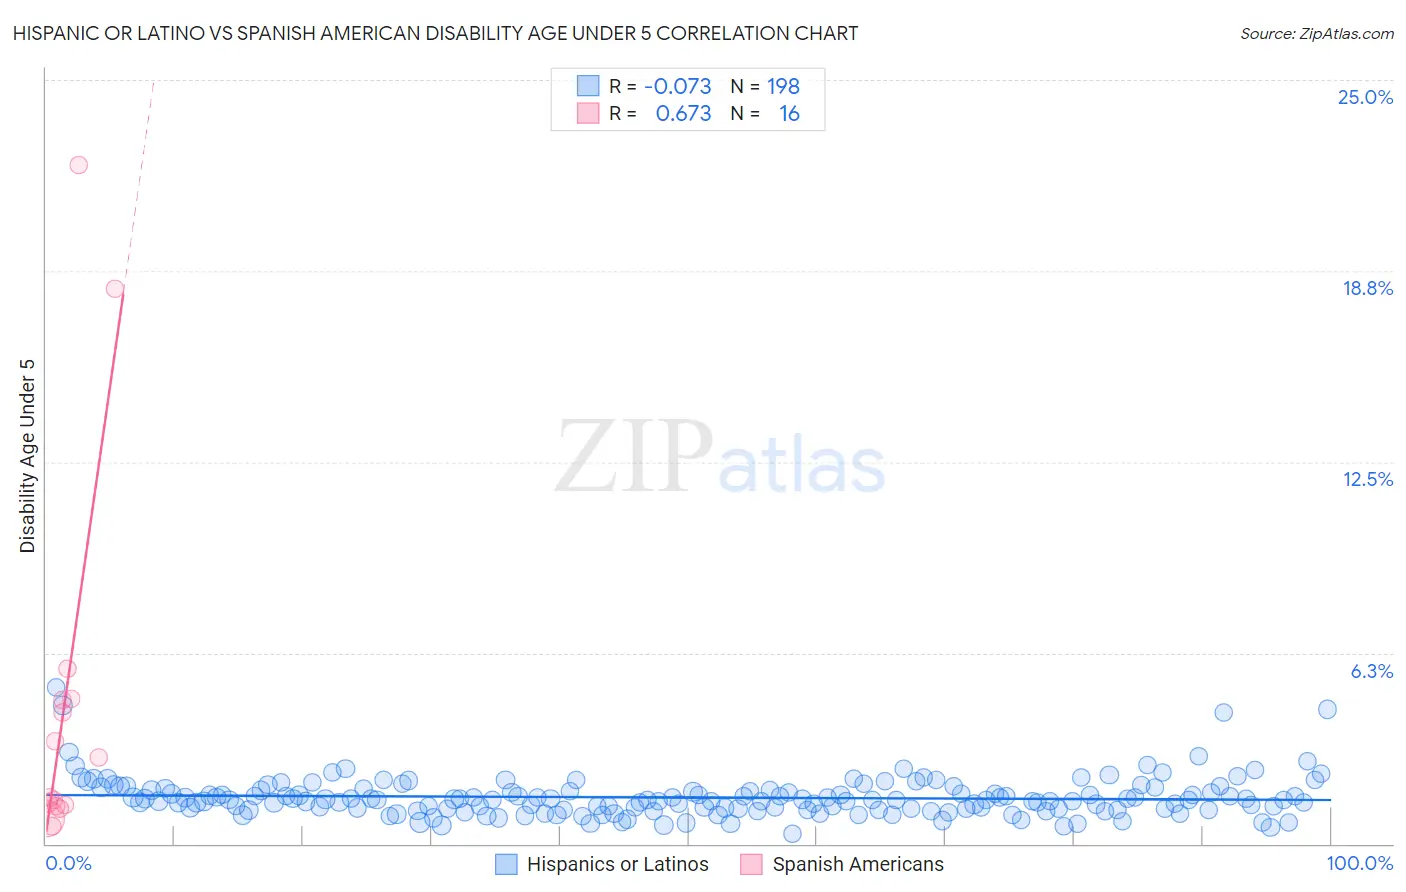
Hispanic or Latino vs Spanish American Disability Age Under 5 Correlation Chart
The statistical analysis conducted on geographies consisting of 261,565,458 people shows a slight negative correlation between the proportion of Hispanics or Latinos and percentage of population with a disability under the age of 5 in the United States with a correlation coefficient (R) of -0.073 and weighted average of 1.3%. Similarly, the statistical analysis conducted on geographies consisting of 83,596,230 people shows a significant positive correlation between the proportion of Spanish Americans and percentage of population with a disability under the age of 5 in the United States with a correlation coefficient (R) of 0.673 and weighted average of 1.1%, a difference of 14.5%.
Disability Age Under 5 Correlation Summary
| Measurement | Hispanic or Latino | Spanish American |
| Minimum | 0.35% | 0.56% |
| Maximum | 5.1% | 22.2% |
| Range | 4.8% | 21.7% |
| Mean | 1.5% | 4.7% |
| Median | 1.4% | 2.2% |
| Interquartile 25% (IQ1) | 1.1% | 1.3% |
| Interquartile 75% (IQ3) | 1.7% | 4.7% |
| Interquartile Range (IQR) | 0.61% | 3.5% |
| Standard Deviation (Sample) | 0.65% | 6.3% |
| Standard Deviation (Population) | 0.65% | 6.1% |
Similar Demographics by Disability Age Under 5
Demographics Similar to Hispanics or Latinos by Disability Age Under 5
In terms of disability age under 5, the demographic groups most similar to Hispanics or Latinos are Latvian (1.3%, a difference of 0.16%), Subsaharan African (1.3%, a difference of 0.19%), Ukrainian (1.3%, a difference of 0.19%), Panamanian (1.3%, a difference of 0.19%), and Bahamian (1.3%, a difference of 0.19%).
| Demographics | Rating | Rank | Disability Age Under 5 |
| Bangladeshis | 15.5 /100 | #216 | Poor 1.3% |
| Cypriots | 14.9 /100 | #217 | Poor 1.3% |
| Malaysians | 13.2 /100 | #218 | Poor 1.3% |
| Immigrants | Croatia | 11.2 /100 | #219 | Poor 1.3% |
| Serbians | 9.6 /100 | #220 | Tragic 1.3% |
| Sub-Saharan Africans | 8.3 /100 | #221 | Tragic 1.3% |
| Ukrainians | 8.3 /100 | #222 | Tragic 1.3% |
| Hispanics or Latinos | 7.7 /100 | #223 | Tragic 1.3% |
| Latvians | 7.1 /100 | #224 | Tragic 1.3% |
| Panamanians | 7.1 /100 | #225 | Tragic 1.3% |
| Bahamians | 7.1 /100 | #226 | Tragic 1.3% |
| Taiwanese | 6.1 /100 | #227 | Tragic 1.3% |
| Luxembourgers | 6.1 /100 | #228 | Tragic 1.3% |
| Immigrants | Costa Rica | 5.5 /100 | #229 | Tragic 1.3% |
| Lebanese | 5.3 /100 | #230 | Tragic 1.3% |
Demographics Similar to Spanish Americans by Disability Age Under 5
In terms of disability age under 5, the demographic groups most similar to Spanish Americans are Immigrants from Cuba (1.1%, a difference of 0.030%), Sri Lankan (1.1%, a difference of 0.060%), Immigrants from Moldova (1.1%, a difference of 0.11%), Albanian (1.1%, a difference of 0.20%), and Mongolian (1.1%, a difference of 0.22%).
| Demographics | Rating | Rank | Disability Age Under 5 |
| Okinawans | 97.6 /100 | #86 | Exceptional 1.1% |
| Ugandans | 97.5 /100 | #87 | Exceptional 1.1% |
| Immigrants | Dominican Republic | 97.5 /100 | #88 | Exceptional 1.1% |
| Ethiopians | 97.2 /100 | #89 | Exceptional 1.1% |
| Chinese | 97.2 /100 | #90 | Exceptional 1.1% |
| Albanians | 97.2 /100 | #91 | Exceptional 1.1% |
| Immigrants | Cuba | 97.0 /100 | #92 | Exceptional 1.1% |
| Spanish Americans | 96.9 /100 | #93 | Exceptional 1.1% |
| Sri Lankans | 96.8 /100 | #94 | Exceptional 1.1% |
| Immigrants | Moldova | 96.8 /100 | #95 | Exceptional 1.1% |
| Mongolians | 96.6 /100 | #96 | Exceptional 1.1% |
| Immigrants | Iraq | 96.5 /100 | #97 | Exceptional 1.1% |
| Immigrants | South Eastern Asia | 96.5 /100 | #98 | Exceptional 1.1% |
| Dominicans | 96.3 /100 | #99 | Exceptional 1.1% |
| Nicaraguans | 96.3 /100 | #100 | Exceptional 1.1% |