Hispanic or Latino vs Spanish American College, Under 1 year
COMPARE
Hispanic or Latino
Spanish American
College, Under 1 year
College, Under 1 year Comparison
Hispanics or Latinos
Spanish Americans
57.0%
COLLEGE, UNDER 1 YEAR
0.0/ 100
METRIC RATING
317th/ 347
METRIC RANK
62.6%
COLLEGE, UNDER 1 YEAR
1.9/ 100
METRIC RATING
235th/ 347
METRIC RANK
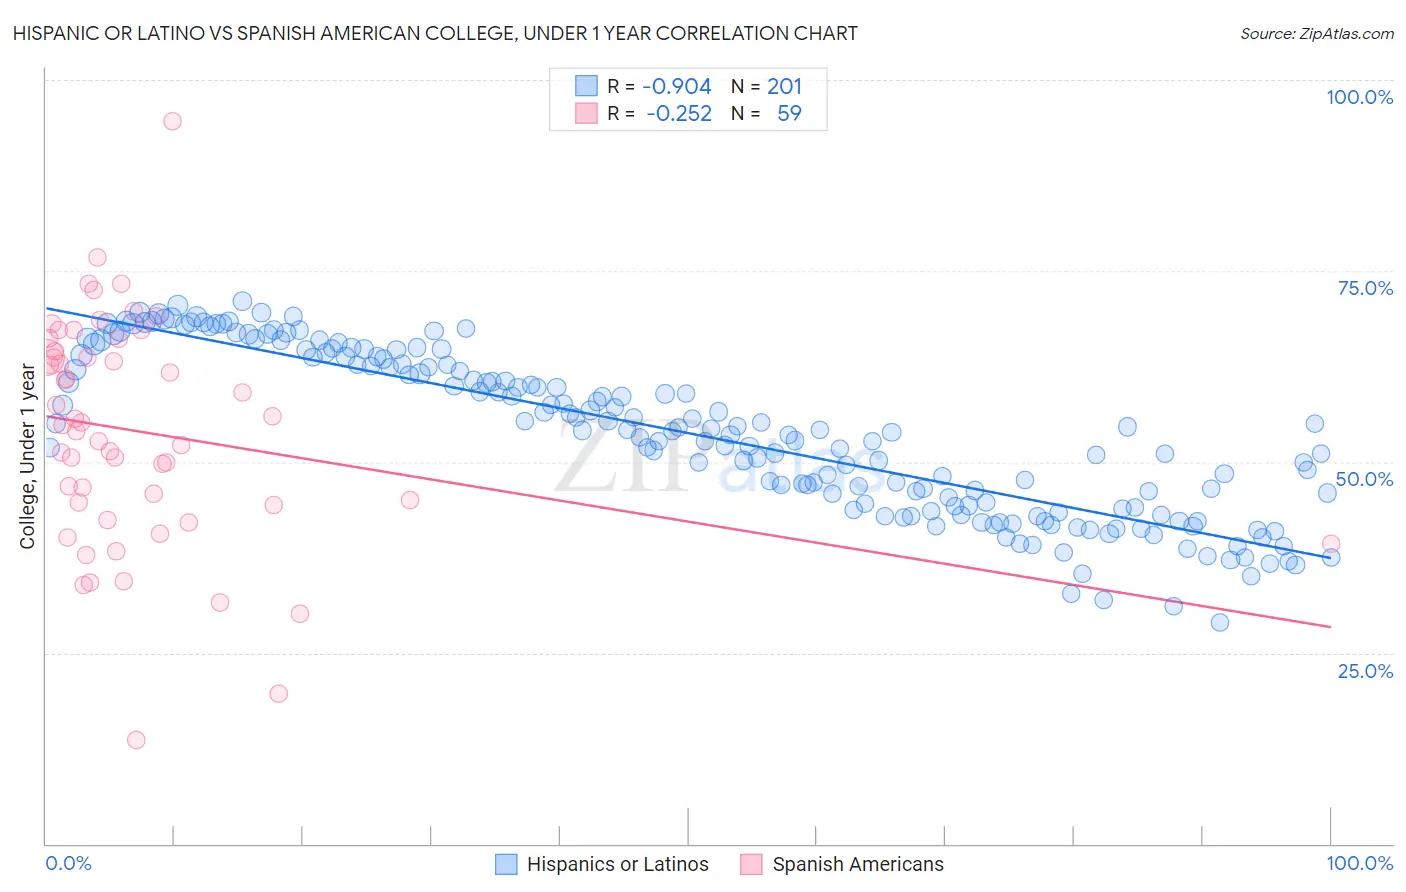
Hispanic or Latino vs Spanish American College, Under 1 year Correlation Chart
The statistical analysis conducted on geographies consisting of 578,595,027 people shows a near-perfect negative correlation between the proportion of Hispanics or Latinos and percentage of population with at least college, under 1 year education in the United States with a correlation coefficient (R) of -0.904 and weighted average of 57.0%. Similarly, the statistical analysis conducted on geographies consisting of 103,168,410 people shows a weak negative correlation between the proportion of Spanish Americans and percentage of population with at least college, under 1 year education in the United States with a correlation coefficient (R) of -0.252 and weighted average of 62.6%, a difference of 9.8%.
College, Under 1 year Correlation Summary
| Measurement | Hispanic or Latino | Spanish American |
| Minimum | 29.0% | 13.6% |
| Maximum | 71.0% | 94.7% |
| Range | 42.1% | 81.0% |
| Mean | 53.7% | 53.9% |
| Median | 54.2% | 54.9% |
| Interquartile 25% (IQ1) | 44.1% | 44.3% |
| Interquartile 75% (IQ3) | 63.6% | 64.5% |
| Interquartile Range (IQR) | 19.5% | 20.2% |
| Standard Deviation (Sample) | 10.5% | 14.8% |
| Standard Deviation (Population) | 10.5% | 14.7% |
Similar Demographics by College, Under 1 year
Demographics Similar to Hispanics or Latinos by College, Under 1 year
In terms of college, under 1 year, the demographic groups most similar to Hispanics or Latinos are Menominee (57.0%, a difference of 0.040%), Honduran (57.1%, a difference of 0.090%), Immigrants from Haiti (56.9%, a difference of 0.12%), Hopi (57.1%, a difference of 0.14%), and Dutch West Indian (57.2%, a difference of 0.26%).
| Demographics | Rating | Rank | College, Under 1 year |
| Pueblo | 0.0 /100 | #310 | Tragic 57.4% |
| Cajuns | 0.0 /100 | #311 | Tragic 57.3% |
| Salvadorans | 0.0 /100 | #312 | Tragic 57.3% |
| Dutch West Indians | 0.0 /100 | #313 | Tragic 57.2% |
| Hopi | 0.0 /100 | #314 | Tragic 57.1% |
| Hondurans | 0.0 /100 | #315 | Tragic 57.1% |
| Menominee | 0.0 /100 | #316 | Tragic 57.0% |
| Hispanics or Latinos | 0.0 /100 | #317 | Tragic 57.0% |
| Immigrants | Haiti | 0.0 /100 | #318 | Tragic 56.9% |
| Puerto Ricans | 0.0 /100 | #319 | Tragic 56.8% |
| Guatemalans | 0.0 /100 | #320 | Tragic 56.8% |
| Natives/Alaskans | 0.0 /100 | #321 | Tragic 56.6% |
| Immigrants | Caribbean | 0.0 /100 | #322 | Tragic 56.6% |
| Immigrants | Honduras | 0.0 /100 | #323 | Tragic 56.5% |
| Immigrants | El Salvador | 0.0 /100 | #324 | Tragic 56.4% |
Demographics Similar to Spanish Americans by College, Under 1 year
In terms of college, under 1 year, the demographic groups most similar to Spanish Americans are Chippewa (62.6%, a difference of 0.050%), Iroquois (62.6%, a difference of 0.080%), Immigrants (62.5%, a difference of 0.13%), Immigrants from Burma/Myanmar (62.5%, a difference of 0.16%), and Osage (62.7%, a difference of 0.20%).
| Demographics | Rating | Rank | College, Under 1 year |
| Samoans | 3.3 /100 | #228 | Tragic 63.0% |
| Liberians | 3.2 /100 | #229 | Tragic 63.0% |
| Immigrants | Nonimmigrants | 3.0 /100 | #230 | Tragic 62.9% |
| Immigrants | Western Africa | 2.4 /100 | #231 | Tragic 62.8% |
| Osage | 2.2 /100 | #232 | Tragic 62.7% |
| Iroquois | 2.0 /100 | #233 | Tragic 62.6% |
| Chippewa | 2.0 /100 | #234 | Tragic 62.6% |
| Spanish Americans | 1.9 /100 | #235 | Tragic 62.6% |
| Immigrants | Immigrants | 1.7 /100 | #236 | Tragic 62.5% |
| Immigrants | Burma/Myanmar | 1.6 /100 | #237 | Tragic 62.5% |
| French American Indians | 1.5 /100 | #238 | Tragic 62.4% |
| Nepalese | 1.1 /100 | #239 | Tragic 62.2% |
| Aleuts | 1.1 /100 | #240 | Tragic 62.2% |
| Ottawa | 1.1 /100 | #241 | Tragic 62.2% |
| Malaysians | 1.1 /100 | #242 | Tragic 62.2% |