Immigrants from Kuwait vs Lebanese Male Poverty
COMPARE
Immigrants from Kuwait
Lebanese
Male Poverty
Male Poverty Comparison
Immigrants from Kuwait
Lebanese
11.6%
MALE POVERTY
17.3/ 100
METRIC RATING
193rd/ 347
METRIC RANK
11.2%
MALE POVERTY
45.6/ 100
METRIC RATING
177th/ 347
METRIC RANK
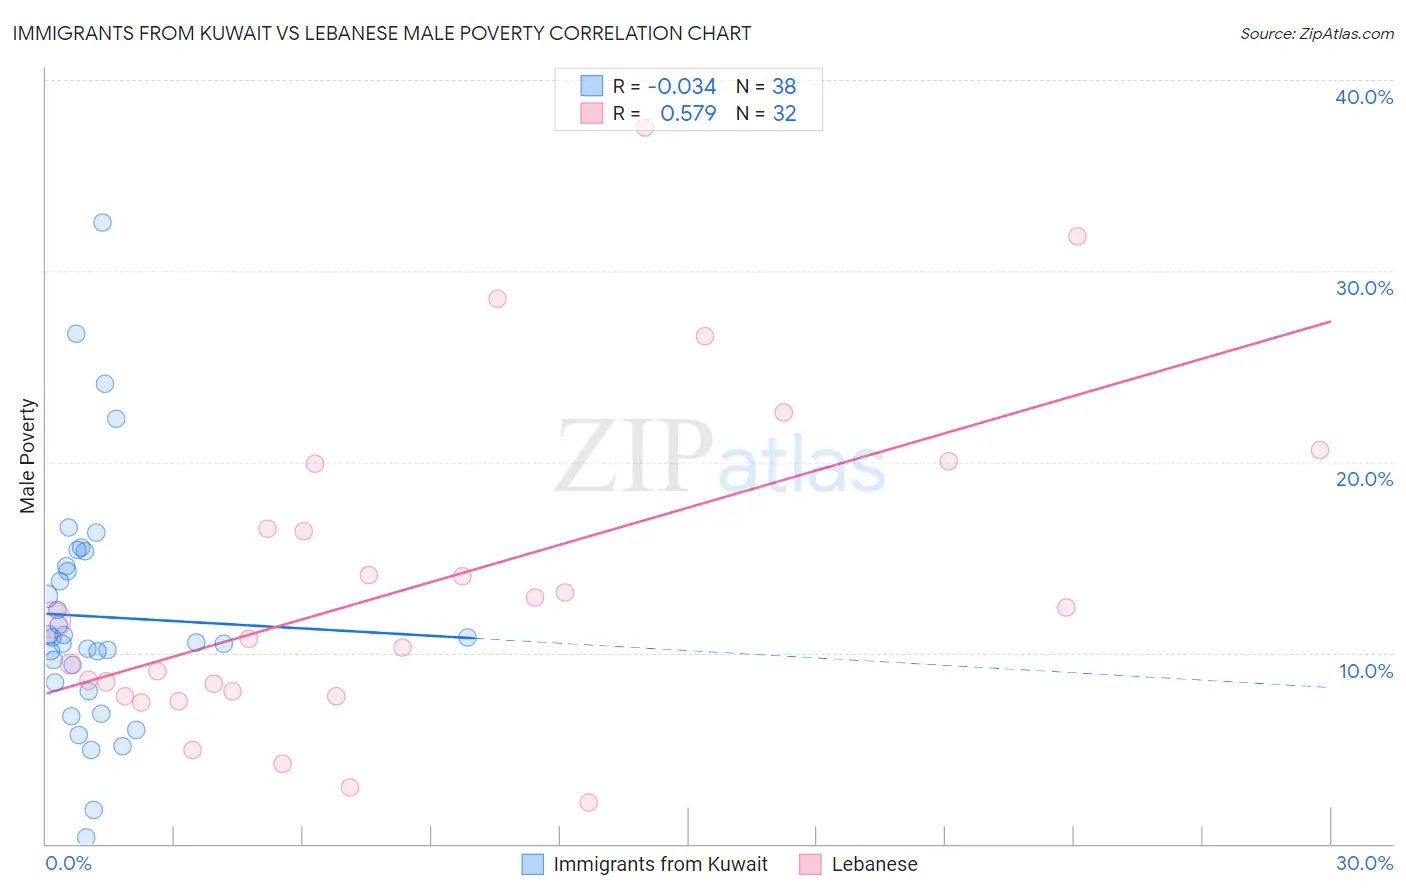
Immigrants from Kuwait vs Lebanese Male Poverty Correlation Chart
The statistical analysis conducted on geographies consisting of 136,838,263 people shows no correlation between the proportion of Immigrants from Kuwait and poverty level among males in the United States with a correlation coefficient (R) of -0.034 and weighted average of 11.6%. Similarly, the statistical analysis conducted on geographies consisting of 401,187,213 people shows a substantial positive correlation between the proportion of Lebanese and poverty level among males in the United States with a correlation coefficient (R) of 0.579 and weighted average of 11.2%, a difference of 3.4%.
Male Poverty Correlation Summary
| Measurement | Immigrants from Kuwait | Lebanese |
| Minimum | 0.32% | 2.1% |
| Maximum | 32.5% | 37.5% |
| Range | 32.2% | 35.4% |
| Mean | 11.9% | 13.6% |
| Median | 10.7% | 11.2% |
| Interquartile 25% (IQ1) | 8.4% | 7.9% |
| Interquartile 75% (IQ3) | 14.6% | 18.2% |
| Interquartile Range (IQR) | 6.1% | 10.3% |
| Standard Deviation (Sample) | 6.4% | 8.5% |
| Standard Deviation (Population) | 6.3% | 8.4% |
Demographics Similar to Immigrants from Kuwait and Lebanese by Male Poverty
In terms of male poverty, the demographic groups most similar to Immigrants from Kuwait are Immigrants from Kenya (11.6%, a difference of 0.21%), Arab (11.6%, a difference of 0.26%), Immigrants from Uruguay (11.6%, a difference of 0.29%), South American Indian (11.5%, a difference of 0.81%), and Israeli (11.5%, a difference of 1.3%). Similarly, the demographic groups most similar to Lebanese are Immigrants from Fiji (11.2%, a difference of 0.040%), Immigrants from Cameroon (11.2%, a difference of 0.11%), Celtic (11.2%, a difference of 0.18%), Immigrants from Syria (11.3%, a difference of 0.54%), and Immigrants from Morocco (11.3%, a difference of 0.55%).
| Demographics | Rating | Rank | Male Poverty |
| Celtics | 47.5 /100 | #175 | Average 11.2% |
| Immigrants | Fiji | 46.0 /100 | #176 | Average 11.2% |
| Lebanese | 45.6 /100 | #177 | Average 11.2% |
| Immigrants | Cameroon | 44.5 /100 | #178 | Average 11.2% |
| Immigrants | Syria | 40.3 /100 | #179 | Average 11.3% |
| Immigrants | Morocco | 40.1 /100 | #180 | Average 11.3% |
| Immigrants | Costa Rica | 39.5 /100 | #181 | Fair 11.3% |
| Mongolians | 39.0 /100 | #182 | Fair 11.3% |
| Kenyans | 38.4 /100 | #183 | Fair 11.3% |
| Immigrants | South America | 36.9 /100 | #184 | Fair 11.3% |
| Immigrants | Afghanistan | 33.3 /100 | #185 | Fair 11.4% |
| Immigrants | Sierra Leone | 32.9 /100 | #186 | Fair 11.4% |
| Immigrants | Iraq | 31.9 /100 | #187 | Fair 11.4% |
| Sierra Leoneans | 29.9 /100 | #188 | Fair 11.4% |
| Hawaiians | 28.3 /100 | #189 | Fair 11.4% |
| Israelis | 26.1 /100 | #190 | Fair 11.5% |
| South American Indians | 22.8 /100 | #191 | Fair 11.5% |
| Immigrants | Uruguay | 19.1 /100 | #192 | Poor 11.6% |
| Immigrants | Kuwait | 17.3 /100 | #193 | Poor 11.6% |
| Immigrants | Kenya | 16.1 /100 | #194 | Poor 11.6% |
| Arabs | 15.8 /100 | #195 | Poor 11.6% |