Hispanic or Latino vs Peruvian Child Poverty Under the Age of 5
COMPARE
Hispanic or Latino
Peruvian
Child Poverty Under the Age of 5
Child Poverty Under the Age of 5 Comparison
Hispanics or Latinos
Peruvians
21.7%
CHILD POVERTY UNDER THE AGE OF 5
0.0/ 100
METRIC RATING
297th/ 347
METRIC RANK
16.0%
CHILD POVERTY UNDER THE AGE OF 5
94.1/ 100
METRIC RATING
112th/ 347
METRIC RANK
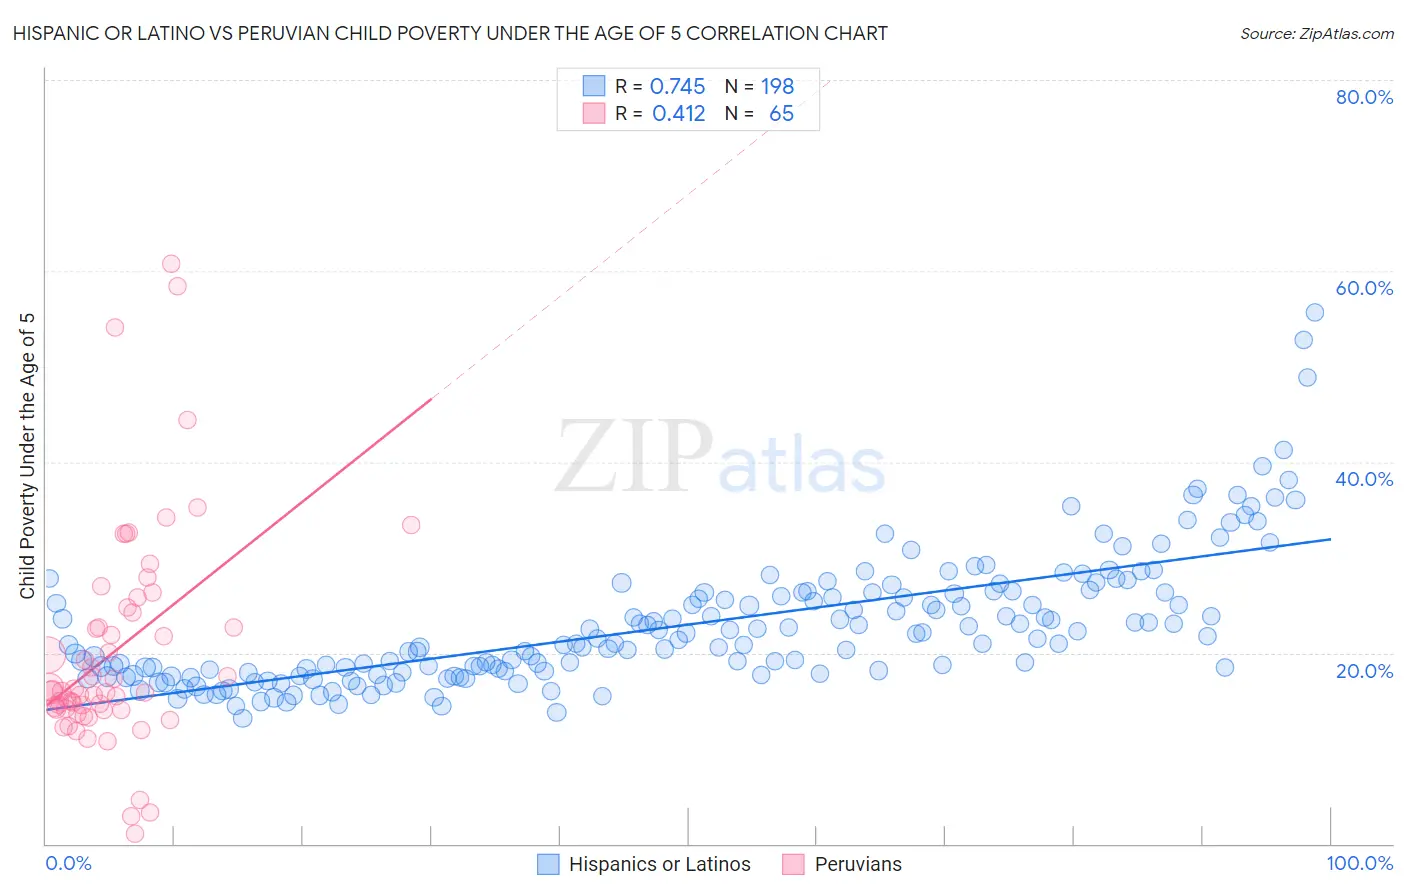
Hispanic or Latino vs Peruvian Child Poverty Under the Age of 5 Correlation Chart
The statistical analysis conducted on geographies consisting of 534,195,934 people shows a strong positive correlation between the proportion of Hispanics or Latinos and poverty level among children under the age of 5 in the United States with a correlation coefficient (R) of 0.745 and weighted average of 21.7%. Similarly, the statistical analysis conducted on geographies consisting of 350,289,776 people shows a moderate positive correlation between the proportion of Peruvians and poverty level among children under the age of 5 in the United States with a correlation coefficient (R) of 0.412 and weighted average of 16.0%, a difference of 35.9%.
Child Poverty Under the Age of 5 Correlation Summary
| Measurement | Hispanic or Latino | Peruvian |
| Minimum | 13.1% | 1.0% |
| Maximum | 55.6% | 60.7% |
| Range | 42.5% | 59.7% |
| Mean | 22.9% | 20.2% |
| Median | 21.0% | 15.9% |
| Interquartile 25% (IQ1) | 18.0% | 14.1% |
| Interquartile 75% (IQ3) | 26.3% | 24.4% |
| Interquartile Range (IQR) | 8.3% | 10.3% |
| Standard Deviation (Sample) | 6.9% | 11.6% |
| Standard Deviation (Population) | 6.9% | 11.5% |
Similar Demographics by Child Poverty Under the Age of 5
Demographics Similar to Hispanics or Latinos by Child Poverty Under the Age of 5
In terms of child poverty under the age of 5, the demographic groups most similar to Hispanics or Latinos are Yaqui (21.7%, a difference of 0.020%), Cherokee (21.7%, a difference of 0.17%), Blackfeet (21.8%, a difference of 0.39%), Chickasaw (21.8%, a difference of 0.39%), and Alaskan Athabascan (21.8%, a difference of 0.40%).
| Demographics | Rating | Rank | Child Poverty Under the Age of 5 |
| Immigrants | Caribbean | 0.0 /100 | #290 | Tragic 21.4% |
| British West Indians | 0.0 /100 | #291 | Tragic 21.4% |
| Immigrants | Somalia | 0.0 /100 | #292 | Tragic 21.6% |
| Mexicans | 0.0 /100 | #293 | Tragic 21.6% |
| Guatemalans | 0.0 /100 | #294 | Tragic 21.6% |
| Cherokee | 0.0 /100 | #295 | Tragic 21.7% |
| Yaqui | 0.0 /100 | #296 | Tragic 21.7% |
| Hispanics or Latinos | 0.0 /100 | #297 | Tragic 21.7% |
| Blackfeet | 0.0 /100 | #298 | Tragic 21.8% |
| Chickasaw | 0.0 /100 | #299 | Tragic 21.8% |
| Alaskan Athabascans | 0.0 /100 | #300 | Tragic 21.8% |
| Immigrants | Central America | 0.0 /100 | #301 | Tragic 22.0% |
| Iroquois | 0.0 /100 | #302 | Tragic 22.0% |
| Inupiat | 0.0 /100 | #303 | Tragic 22.0% |
| Immigrants | Guatemala | 0.0 /100 | #304 | Tragic 22.0% |
Demographics Similar to Peruvians by Child Poverty Under the Age of 5
In terms of child poverty under the age of 5, the demographic groups most similar to Peruvians are Puget Sound Salish (16.0%, a difference of 0.010%), Pakistani (16.0%, a difference of 0.050%), Romanian (16.0%, a difference of 0.090%), Immigrants from Kuwait (16.0%, a difference of 0.090%), and Northern European (16.0%, a difference of 0.10%).
| Demographics | Rating | Rank | Child Poverty Under the Age of 5 |
| Immigrants | Spain | 94.8 /100 | #105 | Exceptional 15.9% |
| Tlingit-Haida | 94.7 /100 | #106 | Exceptional 15.9% |
| Slovenes | 94.4 /100 | #107 | Exceptional 16.0% |
| Immigrants | Brazil | 94.4 /100 | #108 | Exceptional 16.0% |
| Northern Europeans | 94.3 /100 | #109 | Exceptional 16.0% |
| Romanians | 94.3 /100 | #110 | Exceptional 16.0% |
| Pakistanis | 94.2 /100 | #111 | Exceptional 16.0% |
| Peruvians | 94.1 /100 | #112 | Exceptional 16.0% |
| Puget Sound Salish | 94.1 /100 | #113 | Exceptional 16.0% |
| Immigrants | Kuwait | 93.9 /100 | #114 | Exceptional 16.0% |
| Albanians | 93.8 /100 | #115 | Exceptional 16.0% |
| Immigrants | Austria | 93.5 /100 | #116 | Exceptional 16.0% |
| Basques | 93.4 /100 | #117 | Exceptional 16.0% |
| Immigrants | Denmark | 93.4 /100 | #118 | Exceptional 16.0% |
| Immigrants | Jordan | 93.2 /100 | #119 | Exceptional 16.1% |