Northern European vs Immigrants from Costa Rica Female Poverty
COMPARE
Northern European
Immigrants from Costa Rica
Female Poverty
Female Poverty Comparison
Northern Europeans
Immigrants from Costa Rica
12.4%
FEMALE POVERTY
96.6/ 100
METRIC RATING
84th/ 347
METRIC RANK
13.7%
FEMALE POVERTY
31.9/ 100
METRIC RATING
192nd/ 347
METRIC RANK
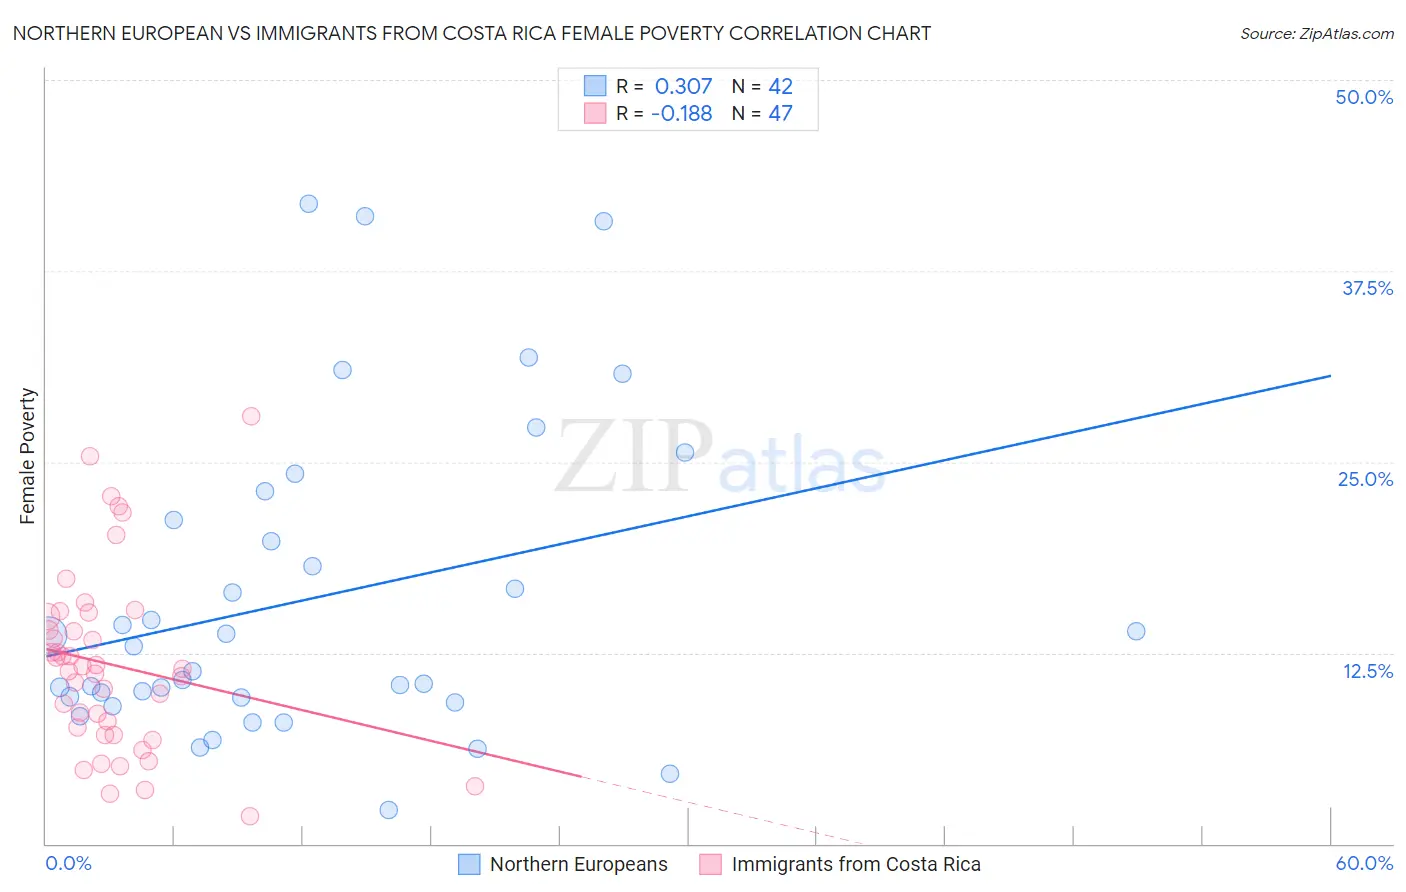
Northern European vs Immigrants from Costa Rica Female Poverty Correlation Chart
The statistical analysis conducted on geographies consisting of 405,818,739 people shows a mild positive correlation between the proportion of Northern Europeans and poverty level among females in the United States with a correlation coefficient (R) of 0.307 and weighted average of 12.4%. Similarly, the statistical analysis conducted on geographies consisting of 204,242,933 people shows a poor negative correlation between the proportion of Immigrants from Costa Rica and poverty level among females in the United States with a correlation coefficient (R) of -0.188 and weighted average of 13.7%, a difference of 10.7%.
Female Poverty Correlation Summary
| Measurement | Northern European | Immigrants from Costa Rica |
| Minimum | 2.2% | 1.8% |
| Maximum | 41.9% | 28.0% |
| Range | 39.7% | 26.2% |
| Mean | 16.1% | 11.7% |
| Median | 12.1% | 11.5% |
| Interquartile 25% (IQ1) | 9.5% | 7.1% |
| Interquartile 75% (IQ3) | 21.2% | 14.9% |
| Interquartile Range (IQR) | 11.6% | 7.7% |
| Standard Deviation (Sample) | 10.2% | 5.9% |
| Standard Deviation (Population) | 10.1% | 5.8% |
Similar Demographics by Female Poverty
Demographics Similar to Northern Europeans by Female Poverty
In terms of female poverty, the demographic groups most similar to Northern Europeans are Irish (12.4%, a difference of 0.050%), Dutch (12.4%, a difference of 0.080%), Okinawan (12.4%, a difference of 0.10%), Finnish (12.4%, a difference of 0.15%), and Immigrants from England (12.3%, a difference of 0.23%).
| Demographics | Rating | Rank | Female Poverty |
| Serbians | 97.2 /100 | #77 | Exceptional 12.3% |
| Egyptians | 97.2 /100 | #78 | Exceptional 12.3% |
| Immigrants | North America | 97.1 /100 | #79 | Exceptional 12.3% |
| Slovaks | 97.1 /100 | #80 | Exceptional 12.3% |
| Immigrants | Sweden | 97.1 /100 | #81 | Exceptional 12.3% |
| Jordanians | 97.1 /100 | #82 | Exceptional 12.3% |
| Immigrants | England | 96.9 /100 | #83 | Exceptional 12.3% |
| Northern Europeans | 96.6 /100 | #84 | Exceptional 12.4% |
| Irish | 96.5 /100 | #85 | Exceptional 12.4% |
| Dutch | 96.5 /100 | #86 | Exceptional 12.4% |
| Okinawans | 96.4 /100 | #87 | Exceptional 12.4% |
| Finns | 96.4 /100 | #88 | Exceptional 12.4% |
| English | 96.1 /100 | #89 | Exceptional 12.4% |
| Immigrants | Denmark | 95.8 /100 | #90 | Exceptional 12.4% |
| Belgians | 95.8 /100 | #91 | Exceptional 12.4% |
Demographics Similar to Immigrants from Costa Rica by Female Poverty
In terms of female poverty, the demographic groups most similar to Immigrants from Costa Rica are Iraqi (13.7%, a difference of 0.020%), Delaware (13.7%, a difference of 0.080%), Immigrants from Kuwait (13.7%, a difference of 0.090%), Sierra Leonean (13.7%, a difference of 0.13%), and Immigrants from South America (13.7%, a difference of 0.14%).
| Demographics | Rating | Rank | Female Poverty |
| Immigrants | Cameroon | 42.0 /100 | #185 | Average 13.5% |
| Immigrants | Portugal | 41.5 /100 | #186 | Average 13.6% |
| Immigrants | Venezuela | 41.0 /100 | #187 | Average 13.6% |
| Hawaiians | 39.9 /100 | #188 | Fair 13.6% |
| Uruguayans | 39.8 /100 | #189 | Fair 13.6% |
| Sierra Leoneans | 33.1 /100 | #190 | Fair 13.7% |
| Immigrants | Kuwait | 32.7 /100 | #191 | Fair 13.7% |
| Immigrants | Costa Rica | 31.9 /100 | #192 | Fair 13.7% |
| Iraqis | 31.8 /100 | #193 | Fair 13.7% |
| Delaware | 31.1 /100 | #194 | Fair 13.7% |
| Immigrants | South America | 30.6 /100 | #195 | Fair 13.7% |
| South American Indians | 28.9 /100 | #196 | Fair 13.7% |
| Arabs | 28.6 /100 | #197 | Fair 13.7% |
| Immigrants | Uganda | 28.5 /100 | #198 | Fair 13.7% |
| Immigrants | Lebanon | 25.6 /100 | #199 | Fair 13.8% |