Cypriot vs Alsatian Single Female Poverty
COMPARE
Cypriot
Alsatian
Single Female Poverty
Single Female Poverty Comparison
Cypriots
Alsatians
19.2%
SINGLE FEMALE POVERTY
99.6/ 100
METRIC RATING
65th/ 347
METRIC RANK
24.5%
SINGLE FEMALE POVERTY
0.0/ 100
METRIC RATING
292nd/ 347
METRIC RANK
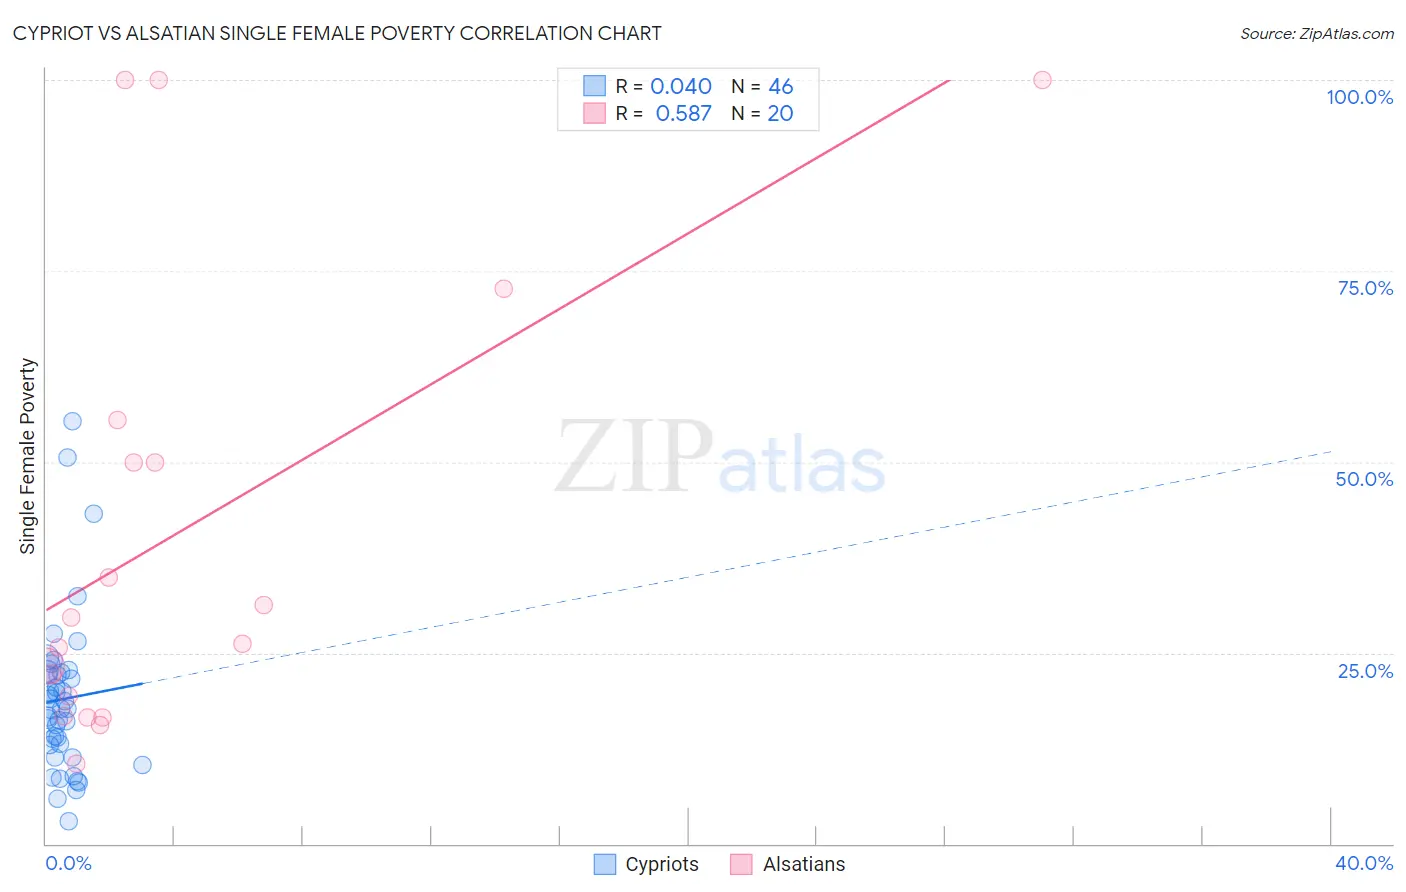
Cypriot vs Alsatian Single Female Poverty Correlation Chart
The statistical analysis conducted on geographies consisting of 61,401,008 people shows no correlation between the proportion of Cypriots and poverty level among single females in the United States with a correlation coefficient (R) of 0.040 and weighted average of 19.2%. Similarly, the statistical analysis conducted on geographies consisting of 82,305,024 people shows a substantial positive correlation between the proportion of Alsatians and poverty level among single females in the United States with a correlation coefficient (R) of 0.587 and weighted average of 24.5%, a difference of 27.4%.
Single Female Poverty Correlation Summary
| Measurement | Cypriot | Alsatian |
| Minimum | 2.9% | 10.5% |
| Maximum | 55.3% | 100.0% |
| Range | 52.4% | 89.5% |
| Mean | 18.9% | 40.8% |
| Median | 17.7% | 27.9% |
| Interquartile 25% (IQ1) | 13.0% | 18.1% |
| Interquartile 75% (IQ3) | 22.5% | 52.7% |
| Interquartile Range (IQR) | 9.5% | 34.6% |
| Standard Deviation (Sample) | 10.4% | 30.0% |
| Standard Deviation (Population) | 10.3% | 29.2% |
Similar Demographics by Single Female Poverty
Demographics Similar to Cypriots by Single Female Poverty
In terms of single female poverty, the demographic groups most similar to Cypriots are Palestinian (19.2%, a difference of 0.020%), Immigrants from Northern Europe (19.2%, a difference of 0.030%), Immigrants from Europe (19.2%, a difference of 0.030%), Immigrants from Egypt (19.2%, a difference of 0.060%), and Laotian (19.3%, a difference of 0.10%).
| Demographics | Rating | Rank | Single Female Poverty |
| Immigrants | Bulgaria | 99.7 /100 | #58 | Exceptional 19.1% |
| Sri Lankans | 99.6 /100 | #59 | Exceptional 19.2% |
| Russians | 99.6 /100 | #60 | Exceptional 19.2% |
| Cambodians | 99.6 /100 | #61 | Exceptional 19.2% |
| Lithuanians | 99.6 /100 | #62 | Exceptional 19.2% |
| Immigrants | Northern Europe | 99.6 /100 | #63 | Exceptional 19.2% |
| Immigrants | Europe | 99.6 /100 | #64 | Exceptional 19.2% |
| Cypriots | 99.6 /100 | #65 | Exceptional 19.2% |
| Palestinians | 99.6 /100 | #66 | Exceptional 19.2% |
| Immigrants | Egypt | 99.6 /100 | #67 | Exceptional 19.2% |
| Laotians | 99.5 /100 | #68 | Exceptional 19.3% |
| Paraguayans | 99.5 /100 | #69 | Exceptional 19.3% |
| Immigrants | Jordan | 99.4 /100 | #70 | Exceptional 19.3% |
| Immigrants | South Eastern Asia | 99.4 /100 | #71 | Exceptional 19.3% |
| Immigrants | Latvia | 99.4 /100 | #72 | Exceptional 19.3% |
Demographics Similar to Alsatians by Single Female Poverty
In terms of single female poverty, the demographic groups most similar to Alsatians are American (24.5%, a difference of 0.080%), French American Indian (24.6%, a difference of 0.23%), Osage (24.4%, a difference of 0.37%), Hispanic or Latino (24.6%, a difference of 0.57%), and Indonesian (24.3%, a difference of 0.97%).
| Demographics | Rating | Rank | Single Female Poverty |
| Immigrants | Guatemala | 0.0 /100 | #285 | Tragic 24.1% |
| Cree | 0.0 /100 | #286 | Tragic 24.1% |
| Bangladeshis | 0.0 /100 | #287 | Tragic 24.2% |
| Spanish Americans | 0.0 /100 | #288 | Tragic 24.2% |
| U.S. Virgin Islanders | 0.0 /100 | #289 | Tragic 24.2% |
| Indonesians | 0.0 /100 | #290 | Tragic 24.3% |
| Osage | 0.0 /100 | #291 | Tragic 24.4% |
| Alsatians | 0.0 /100 | #292 | Tragic 24.5% |
| Americans | 0.0 /100 | #293 | Tragic 24.5% |
| French American Indians | 0.0 /100 | #294 | Tragic 24.6% |
| Hispanics or Latinos | 0.0 /100 | #295 | Tragic 24.6% |
| Africans | 0.0 /100 | #296 | Tragic 24.8% |
| Immigrants | Central America | 0.0 /100 | #297 | Tragic 24.8% |
| Yaqui | 0.0 /100 | #298 | Tragic 24.9% |
| Mexicans | 0.0 /100 | #299 | Tragic 25.0% |