Haitian vs Pueblo Ambulatory Disability
COMPARE
Haitian
Pueblo
Ambulatory Disability
Ambulatory Disability Comparison
Haitians
Pueblo
6.4%
AMBULATORY DISABILITY
1.8/ 100
METRIC RATING
238th/ 347
METRIC RANK
7.6%
AMBULATORY DISABILITY
0.0/ 100
METRIC RATING
329th/ 347
METRIC RANK
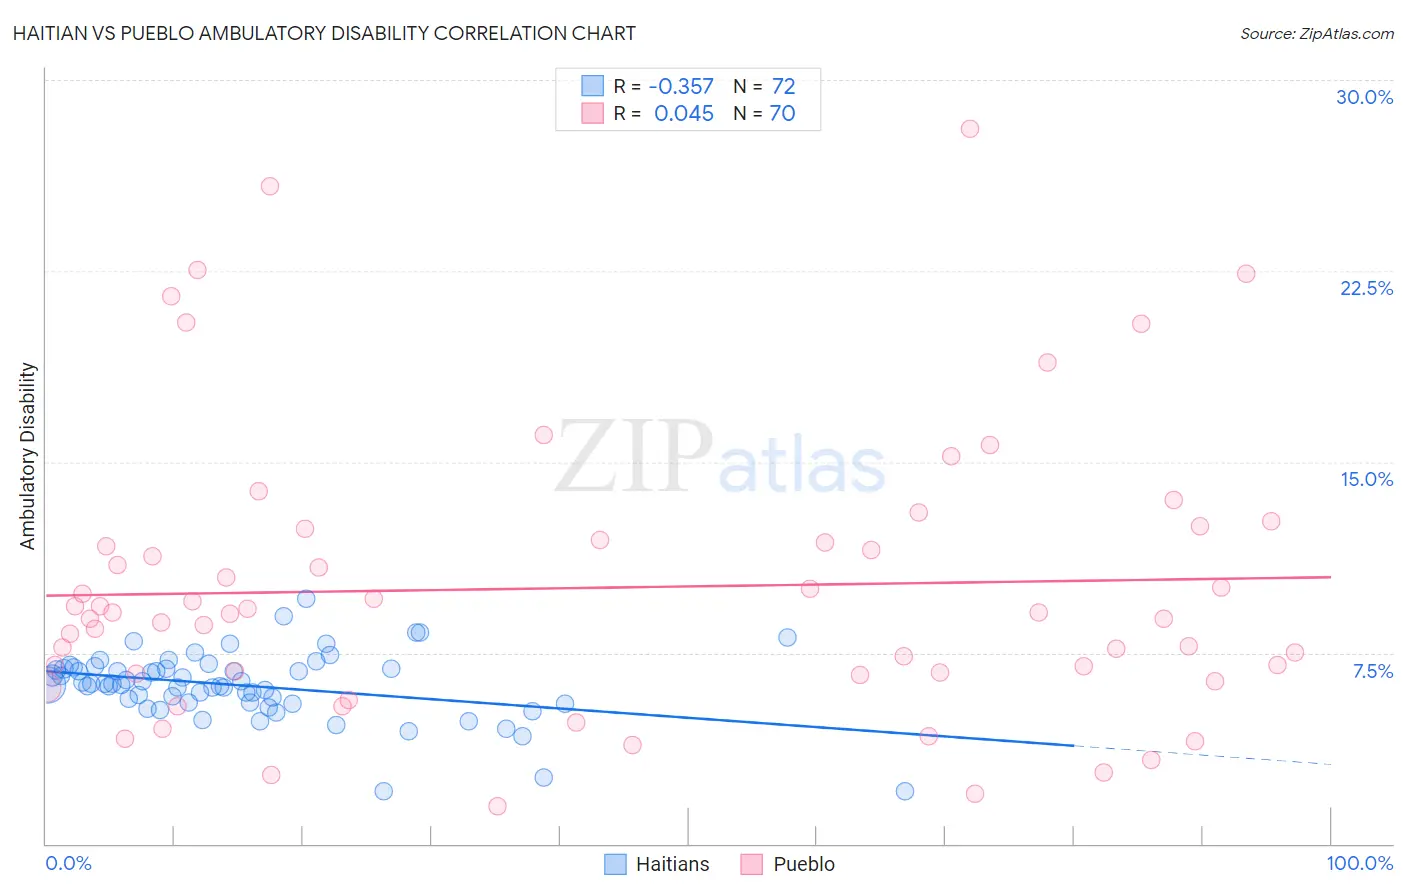
Haitian vs Pueblo Ambulatory Disability Correlation Chart
The statistical analysis conducted on geographies consisting of 287,779,605 people shows a mild negative correlation between the proportion of Haitians and percentage of population with ambulatory disability in the United States with a correlation coefficient (R) of -0.357 and weighted average of 6.4%. Similarly, the statistical analysis conducted on geographies consisting of 120,067,140 people shows no correlation between the proportion of Pueblo and percentage of population with ambulatory disability in the United States with a correlation coefficient (R) of 0.045 and weighted average of 7.6%, a difference of 17.9%.
Ambulatory Disability Correlation Summary
| Measurement | Haitian | Pueblo |
| Minimum | 2.1% | 1.5% |
| Maximum | 9.6% | 28.1% |
| Range | 7.6% | 26.6% |
| Mean | 6.2% | 10.1% |
| Median | 6.3% | 9.1% |
| Interquartile 25% (IQ1) | 5.5% | 6.7% |
| Interquartile 75% (IQ3) | 6.9% | 11.9% |
| Interquartile Range (IQR) | 1.3% | 5.2% |
| Standard Deviation (Sample) | 1.3% | 5.6% |
| Standard Deviation (Population) | 1.3% | 5.6% |
Similar Demographics by Ambulatory Disability
Demographics Similar to Haitians by Ambulatory Disability
In terms of ambulatory disability, the demographic groups most similar to Haitians are Immigrants from Germany (6.4%, a difference of 0.010%), Senegalese (6.4%, a difference of 0.070%), Immigrants from Senegal (6.4%, a difference of 0.090%), Dutch (6.4%, a difference of 0.10%), and Immigrants from Haiti (6.5%, a difference of 0.18%).
| Demographics | Rating | Rank | Ambulatory Disability |
| Panamanians | 3.1 /100 | #231 | Tragic 6.4% |
| Assyrians/Chaldeans/Syriacs | 2.4 /100 | #232 | Tragic 6.4% |
| Sub-Saharan Africans | 2.3 /100 | #233 | Tragic 6.4% |
| Immigrants | Liberia | 2.3 /100 | #234 | Tragic 6.4% |
| Hispanics or Latinos | 2.2 /100 | #235 | Tragic 6.4% |
| Dutch | 2.0 /100 | #236 | Tragic 6.4% |
| Immigrants | Germany | 1.8 /100 | #237 | Tragic 6.4% |
| Haitians | 1.8 /100 | #238 | Tragic 6.4% |
| Senegalese | 1.7 /100 | #239 | Tragic 6.4% |
| Immigrants | Senegal | 1.7 /100 | #240 | Tragic 6.4% |
| Immigrants | Haiti | 1.6 /100 | #241 | Tragic 6.5% |
| Spaniards | 1.6 /100 | #242 | Tragic 6.5% |
| Germans | 1.5 /100 | #243 | Tragic 6.5% |
| Immigrants | Panama | 1.5 /100 | #244 | Tragic 6.5% |
| Tlingit-Haida | 1.5 /100 | #245 | Tragic 6.5% |
Demographics Similar to Pueblo by Ambulatory Disability
In terms of ambulatory disability, the demographic groups most similar to Pueblo are Hopi (7.6%, a difference of 0.040%), Native/Alaskan (7.5%, a difference of 0.98%), Black/African American (7.5%, a difference of 0.99%), Comanche (7.5%, a difference of 1.1%), and Navajo (7.5%, a difference of 1.2%).
| Demographics | Rating | Rank | Ambulatory Disability |
| Osage | 0.0 /100 | #322 | Tragic 7.4% |
| Americans | 0.0 /100 | #323 | Tragic 7.4% |
| Navajo | 0.0 /100 | #324 | Tragic 7.5% |
| Comanche | 0.0 /100 | #325 | Tragic 7.5% |
| Blacks/African Americans | 0.0 /100 | #326 | Tragic 7.5% |
| Natives/Alaskans | 0.0 /100 | #327 | Tragic 7.5% |
| Hopi | 0.0 /100 | #328 | Tragic 7.6% |
| Pueblo | 0.0 /100 | #329 | Tragic 7.6% |
| Paiute | 0.0 /100 | #330 | Tragic 7.7% |
| Cajuns | 0.0 /100 | #331 | Tragic 7.8% |
| Menominee | 0.0 /100 | #332 | Tragic 7.8% |
| Cherokee | 0.0 /100 | #333 | Tragic 7.9% |
| Yuman | 0.0 /100 | #334 | Tragic 7.9% |
| Chickasaw | 0.0 /100 | #335 | Tragic 8.0% |
| Seminole | 0.0 /100 | #336 | Tragic 8.0% |