Haitian vs Immigrants Female Poverty Among 25-34 Year Olds
COMPARE
Haitian
Immigrants
Female Poverty Among 25-34 Year Olds
Female Poverty Among 25-34 Year Olds Comparison
Haitians
Immigrants
15.0%
FEMALE POVERTY AMONG 25-34 YEAR OLDS
0.5/ 100
METRIC RATING
251st/ 347
METRIC RANK
14.0%
FEMALE POVERTY AMONG 25-34 YEAR OLDS
14.5/ 100
METRIC RATING
203rd/ 347
METRIC RANK
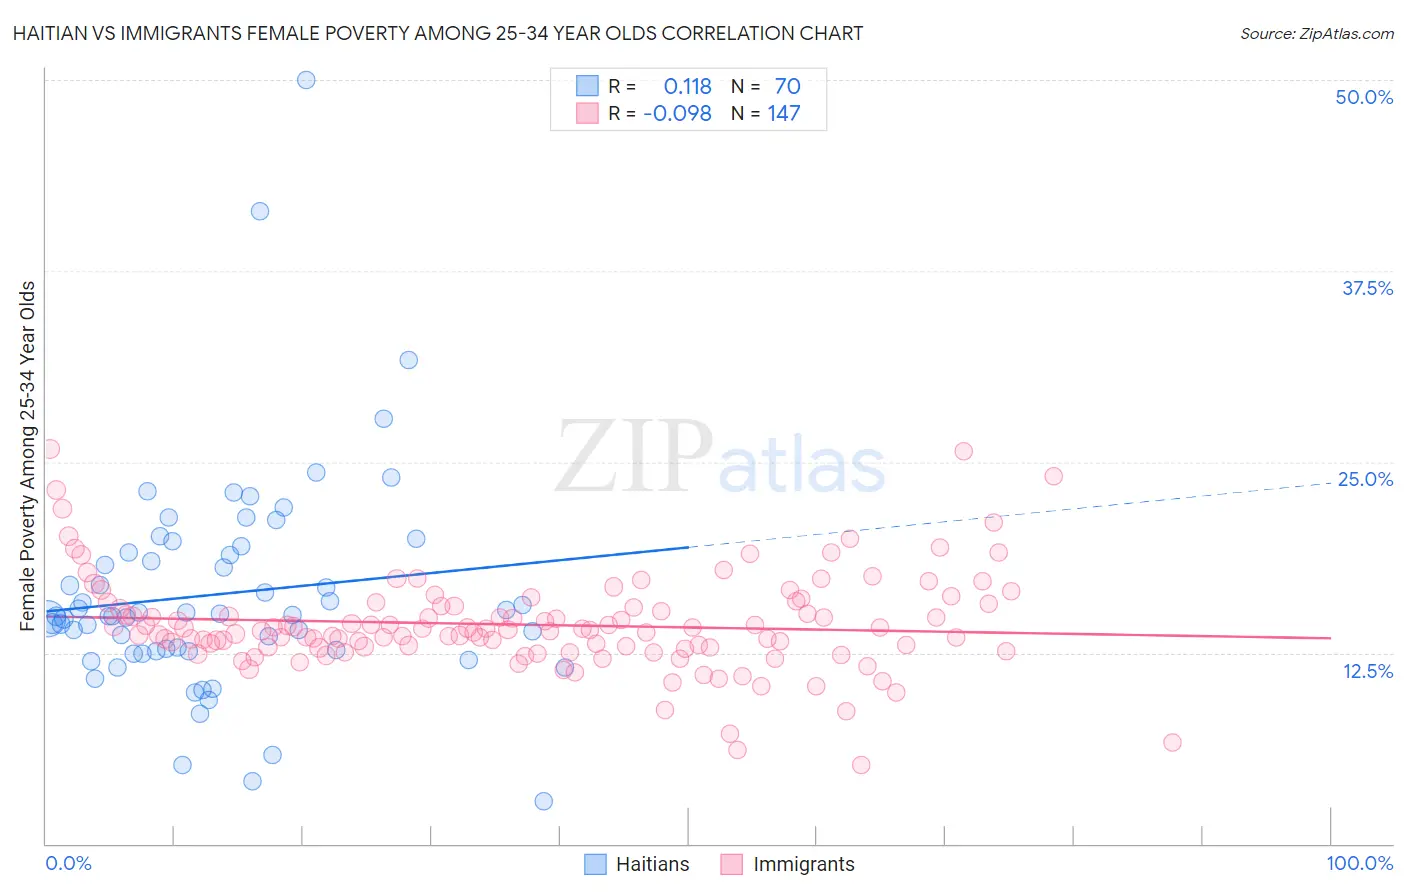
Haitian vs Immigrants Female Poverty Among 25-34 Year Olds Correlation Chart
The statistical analysis conducted on geographies consisting of 284,910,103 people shows a poor positive correlation between the proportion of Haitians and poverty level among females between the ages 25 and 34 in the United States with a correlation coefficient (R) of 0.118 and weighted average of 15.0%. Similarly, the statistical analysis conducted on geographies consisting of 554,833,971 people shows a slight negative correlation between the proportion of Immigrants and poverty level among females between the ages 25 and 34 in the United States with a correlation coefficient (R) of -0.098 and weighted average of 14.0%, a difference of 7.2%.
Female Poverty Among 25-34 Year Olds Correlation Summary
| Measurement | Haitian | Immigrants |
| Minimum | 2.8% | 5.1% |
| Maximum | 50.0% | 25.8% |
| Range | 47.2% | 20.7% |
| Mean | 16.4% | 14.3% |
| Median | 14.9% | 14.0% |
| Interquartile 25% (IQ1) | 12.6% | 12.9% |
| Interquartile 75% (IQ3) | 19.1% | 15.5% |
| Interquartile Range (IQR) | 6.4% | 2.7% |
| Standard Deviation (Sample) | 7.3% | 3.2% |
| Standard Deviation (Population) | 7.2% | 3.2% |
Similar Demographics by Female Poverty Among 25-34 Year Olds
Demographics Similar to Haitians by Female Poverty Among 25-34 Year Olds
In terms of female poverty among 25-34 year olds, the demographic groups most similar to Haitians are Belizean (15.1%, a difference of 0.17%), Immigrants from El Salvador (15.0%, a difference of 0.19%), Immigrants from Haiti (15.0%, a difference of 0.22%), Immigrants from West Indies (15.1%, a difference of 0.31%), and Somali (15.1%, a difference of 0.39%).
| Demographics | Rating | Rank | Female Poverty Among 25-34 Year Olds |
| Immigrants | Bangladesh | 1.1 /100 | #244 | Tragic 14.8% |
| Immigrants | Middle Africa | 1.0 /100 | #245 | Tragic 14.8% |
| Jamaicans | 1.0 /100 | #246 | Tragic 14.8% |
| German Russians | 0.8 /100 | #247 | Tragic 14.9% |
| Immigrants | Western Africa | 0.8 /100 | #248 | Tragic 14.9% |
| Immigrants | Haiti | 0.5 /100 | #249 | Tragic 15.0% |
| Immigrants | El Salvador | 0.5 /100 | #250 | Tragic 15.0% |
| Haitians | 0.5 /100 | #251 | Tragic 15.0% |
| Belizeans | 0.4 /100 | #252 | Tragic 15.1% |
| Immigrants | West Indies | 0.4 /100 | #253 | Tragic 15.1% |
| Somalis | 0.4 /100 | #254 | Tragic 15.1% |
| Immigrants | Laos | 0.3 /100 | #255 | Tragic 15.2% |
| West Indians | 0.3 /100 | #256 | Tragic 15.2% |
| Immigrants | Burma/Myanmar | 0.3 /100 | #257 | Tragic 15.2% |
| Nepalese | 0.2 /100 | #258 | Tragic 15.2% |
Demographics Similar to Immigrants by Female Poverty Among 25-34 Year Olds
In terms of female poverty among 25-34 year olds, the demographic groups most similar to Immigrants are Hawaiian (14.1%, a difference of 0.15%), Immigrants from Africa (14.1%, a difference of 0.19%), Welsh (14.0%, a difference of 0.41%), Immigrants from Trinidad and Tobago (14.0%, a difference of 0.46%), and Hungarian (14.1%, a difference of 0.48%).
| Demographics | Rating | Rank | Female Poverty Among 25-34 Year Olds |
| Scottish | 23.6 /100 | #196 | Fair 13.9% |
| Immigrants | Saudi Arabia | 21.9 /100 | #197 | Fair 13.9% |
| Immigrants | Germany | 20.9 /100 | #198 | Fair 13.9% |
| English | 20.4 /100 | #199 | Fair 13.9% |
| Hmong | 20.3 /100 | #200 | Fair 13.9% |
| Immigrants | Trinidad and Tobago | 17.6 /100 | #201 | Poor 14.0% |
| Welsh | 17.2 /100 | #202 | Poor 14.0% |
| Immigrants | Immigrants | 14.5 /100 | #203 | Poor 14.0% |
| Hawaiians | 13.6 /100 | #204 | Poor 14.1% |
| Immigrants | Africa | 13.4 /100 | #205 | Poor 14.1% |
| Hungarians | 11.8 /100 | #206 | Poor 14.1% |
| Japanese | 11.7 /100 | #207 | Poor 14.1% |
| Immigrants | Panama | 11.6 /100 | #208 | Poor 14.1% |
| Guyanese | 8.6 /100 | #209 | Tragic 14.2% |
| Panamanians | 8.6 /100 | #210 | Tragic 14.2% |