Immigrants from Western Europe vs Immigrants Female Poverty Among 25-34 Year Olds
COMPARE
Immigrants from Western Europe
Immigrants
Female Poverty Among 25-34 Year Olds
Female Poverty Among 25-34 Year Olds Comparison
Immigrants from Western Europe
Immigrants
13.3%
FEMALE POVERTY AMONG 25-34 YEAR OLDS
70.3/ 100
METRIC RATING
157th/ 347
METRIC RANK
14.0%
FEMALE POVERTY AMONG 25-34 YEAR OLDS
14.5/ 100
METRIC RATING
203rd/ 347
METRIC RANK
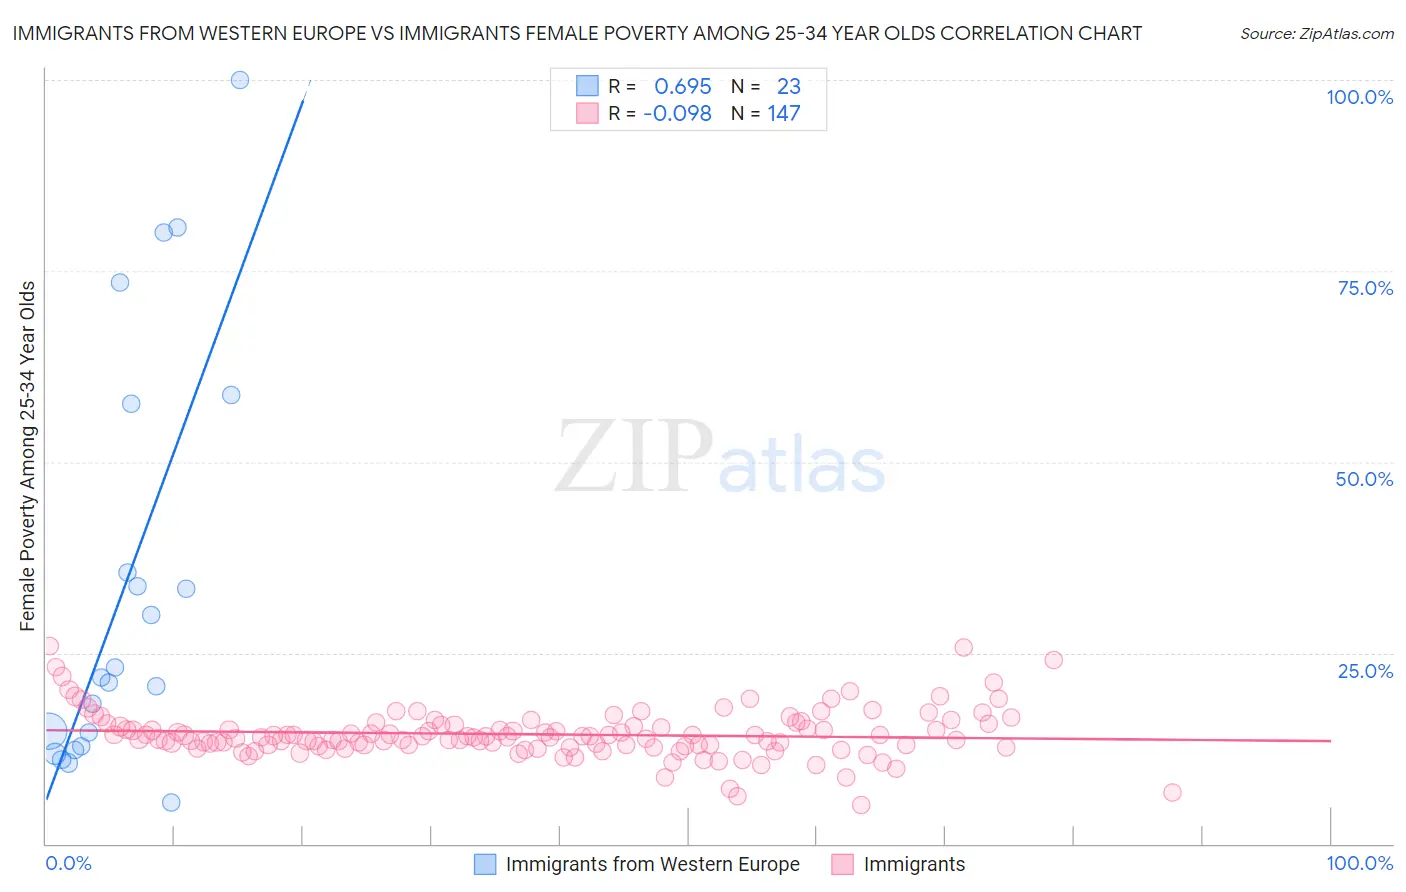
Immigrants from Western Europe vs Immigrants Female Poverty Among 25-34 Year Olds Correlation Chart
The statistical analysis conducted on geographies consisting of 481,489,982 people shows a significant positive correlation between the proportion of Immigrants from Western Europe and poverty level among females between the ages 25 and 34 in the United States with a correlation coefficient (R) of 0.695 and weighted average of 13.3%. Similarly, the statistical analysis conducted on geographies consisting of 554,833,971 people shows a slight negative correlation between the proportion of Immigrants and poverty level among females between the ages 25 and 34 in the United States with a correlation coefficient (R) of -0.098 and weighted average of 14.0%, a difference of 5.6%.
Female Poverty Among 25-34 Year Olds Correlation Summary
| Measurement | Immigrants from Western Europe | Immigrants |
| Minimum | 5.4% | 5.1% |
| Maximum | 100.0% | 25.8% |
| Range | 94.6% | 20.7% |
| Mean | 34.0% | 14.3% |
| Median | 21.8% | 14.0% |
| Interquartile 25% (IQ1) | 12.8% | 12.9% |
| Interquartile 75% (IQ3) | 57.6% | 15.5% |
| Interquartile Range (IQR) | 44.7% | 2.7% |
| Standard Deviation (Sample) | 27.2% | 3.2% |
| Standard Deviation (Population) | 26.6% | 3.2% |
Similar Demographics by Female Poverty Among 25-34 Year Olds
Demographics Similar to Immigrants from Western Europe by Female Poverty Among 25-34 Year Olds
In terms of female poverty among 25-34 year olds, the demographic groups most similar to Immigrants from Western Europe are Immigrants from Colombia (13.3%, a difference of 0.11%), Immigrants from Cameroon (13.3%, a difference of 0.17%), Immigrants from Sierra Leone (13.3%, a difference of 0.27%), Arab (13.2%, a difference of 0.33%), and Uruguayan (13.3%, a difference of 0.33%).
| Demographics | Rating | Rank | Female Poverty Among 25-34 Year Olds |
| Iraqis | 76.0 /100 | #150 | Good 13.2% |
| Costa Ricans | 75.8 /100 | #151 | Good 13.2% |
| Slavs | 75.7 /100 | #152 | Good 13.2% |
| Northern Europeans | 73.7 /100 | #153 | Good 13.2% |
| Arabs | 73.5 /100 | #154 | Good 13.2% |
| Immigrants | Sierra Leone | 72.9 /100 | #155 | Good 13.3% |
| Immigrants | Cameroon | 72.0 /100 | #156 | Good 13.3% |
| Immigrants | Western Europe | 70.3 /100 | #157 | Good 13.3% |
| Immigrants | Colombia | 69.2 /100 | #158 | Good 13.3% |
| Uruguayans | 66.9 /100 | #159 | Good 13.3% |
| Immigrants | South America | 66.3 /100 | #160 | Good 13.3% |
| Icelanders | 65.7 /100 | #161 | Good 13.3% |
| Ugandans | 64.1 /100 | #162 | Good 13.4% |
| British | 63.5 /100 | #163 | Good 13.4% |
| Swiss | 61.7 /100 | #164 | Good 13.4% |
Demographics Similar to Immigrants by Female Poverty Among 25-34 Year Olds
In terms of female poverty among 25-34 year olds, the demographic groups most similar to Immigrants are Hawaiian (14.1%, a difference of 0.15%), Immigrants from Africa (14.1%, a difference of 0.19%), Welsh (14.0%, a difference of 0.41%), Immigrants from Trinidad and Tobago (14.0%, a difference of 0.46%), and Hungarian (14.1%, a difference of 0.48%).
| Demographics | Rating | Rank | Female Poverty Among 25-34 Year Olds |
| Scottish | 23.6 /100 | #196 | Fair 13.9% |
| Immigrants | Saudi Arabia | 21.9 /100 | #197 | Fair 13.9% |
| Immigrants | Germany | 20.9 /100 | #198 | Fair 13.9% |
| English | 20.4 /100 | #199 | Fair 13.9% |
| Hmong | 20.3 /100 | #200 | Fair 13.9% |
| Immigrants | Trinidad and Tobago | 17.6 /100 | #201 | Poor 14.0% |
| Welsh | 17.2 /100 | #202 | Poor 14.0% |
| Immigrants | Immigrants | 14.5 /100 | #203 | Poor 14.0% |
| Hawaiians | 13.6 /100 | #204 | Poor 14.1% |
| Immigrants | Africa | 13.4 /100 | #205 | Poor 14.1% |
| Hungarians | 11.8 /100 | #206 | Poor 14.1% |
| Japanese | 11.7 /100 | #207 | Poor 14.1% |
| Immigrants | Panama | 11.6 /100 | #208 | Poor 14.1% |
| Guyanese | 8.6 /100 | #209 | Tragic 14.2% |
| Panamanians | 8.6 /100 | #210 | Tragic 14.2% |