Sioux vs Immigrants Female Poverty Among 25-34 Year Olds
COMPARE
Sioux
Immigrants
Female Poverty Among 25-34 Year Olds
Female Poverty Among 25-34 Year Olds Comparison
Sioux
Immigrants
23.0%
FEMALE POVERTY AMONG 25-34 YEAR OLDS
0.0/ 100
METRIC RATING
340th/ 347
METRIC RANK
14.0%
FEMALE POVERTY AMONG 25-34 YEAR OLDS
14.5/ 100
METRIC RATING
203rd/ 347
METRIC RANK
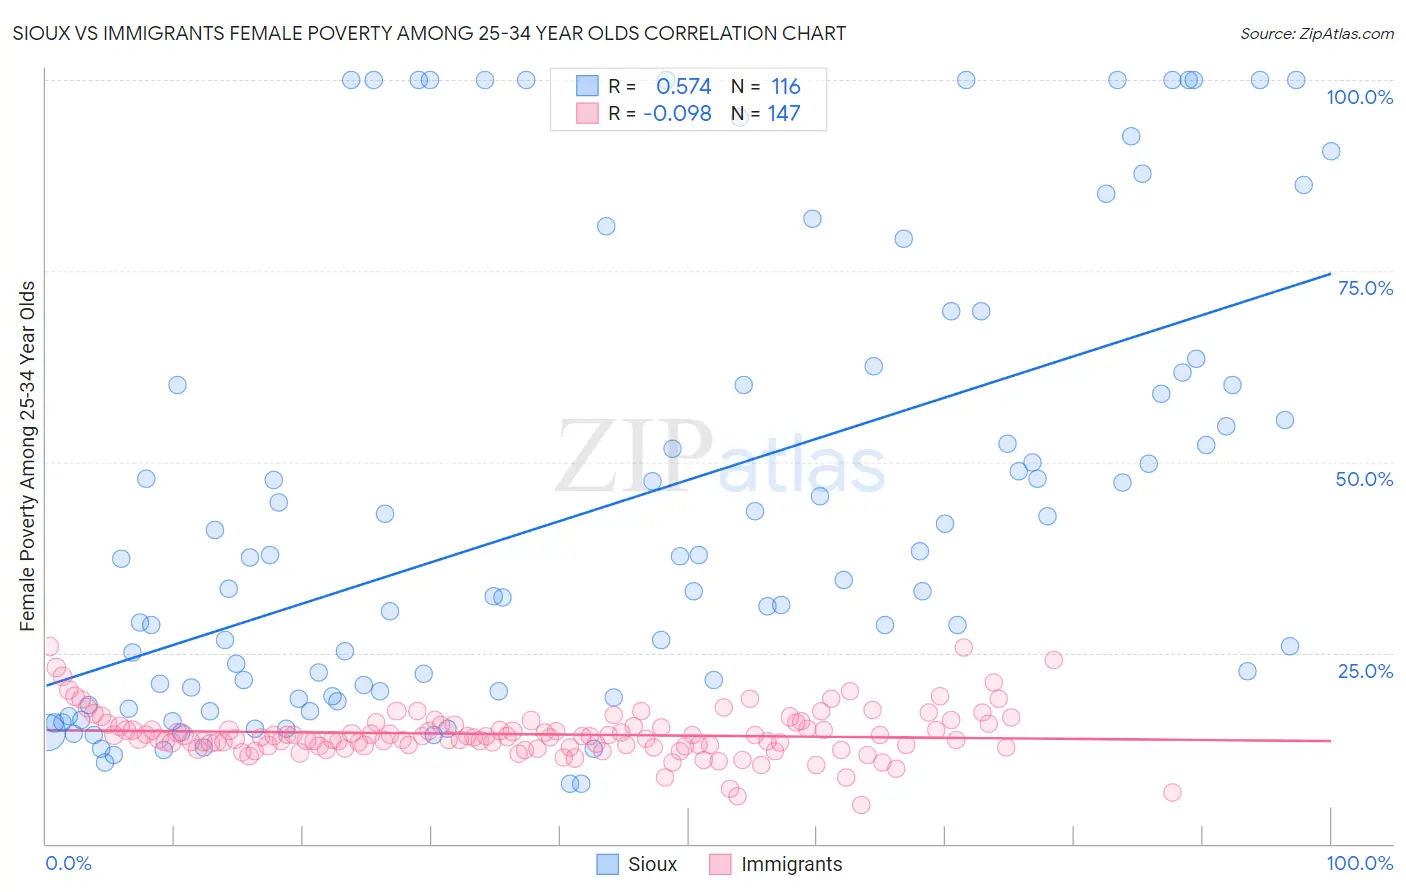
Sioux vs Immigrants Female Poverty Among 25-34 Year Olds Correlation Chart
The statistical analysis conducted on geographies consisting of 232,165,321 people shows a substantial positive correlation between the proportion of Sioux and poverty level among females between the ages 25 and 34 in the United States with a correlation coefficient (R) of 0.574 and weighted average of 23.0%. Similarly, the statistical analysis conducted on geographies consisting of 554,833,971 people shows a slight negative correlation between the proportion of Immigrants and poverty level among females between the ages 25 and 34 in the United States with a correlation coefficient (R) of -0.098 and weighted average of 14.0%, a difference of 63.6%.
Female Poverty Among 25-34 Year Olds Correlation Summary
| Measurement | Sioux | Immigrants |
| Minimum | 7.9% | 5.1% |
| Maximum | 100.0% | 25.8% |
| Range | 92.1% | 20.7% |
| Mean | 44.2% | 14.3% |
| Median | 36.0% | 14.0% |
| Interquartile 25% (IQ1) | 19.6% | 12.9% |
| Interquartile 75% (IQ3) | 60.0% | 15.5% |
| Interquartile Range (IQR) | 40.4% | 2.7% |
| Standard Deviation (Sample) | 29.3% | 3.2% |
| Standard Deviation (Population) | 29.2% | 3.2% |
Similar Demographics by Female Poverty Among 25-34 Year Olds
Demographics Similar to Sioux by Female Poverty Among 25-34 Year Olds
In terms of female poverty among 25-34 year olds, the demographic groups most similar to Sioux are Yuman (22.9%, a difference of 0.18%), Houma (22.7%, a difference of 1.0%), Crow (22.7%, a difference of 1.2%), Navajo (23.3%, a difference of 1.7%), and Hopi (23.7%, a difference of 3.1%).
| Demographics | Rating | Rank | Female Poverty Among 25-34 Year Olds |
| Cajuns | 0.0 /100 | #333 | Tragic 19.9% |
| Apache | 0.0 /100 | #334 | Tragic 20.1% |
| Natives/Alaskans | 0.0 /100 | #335 | Tragic 20.3% |
| Pueblo | 0.0 /100 | #336 | Tragic 22.2% |
| Crow | 0.0 /100 | #337 | Tragic 22.7% |
| Houma | 0.0 /100 | #338 | Tragic 22.7% |
| Yuman | 0.0 /100 | #339 | Tragic 22.9% |
| Sioux | 0.0 /100 | #340 | Tragic 23.0% |
| Navajo | 0.0 /100 | #341 | Tragic 23.3% |
| Hopi | 0.0 /100 | #342 | Tragic 23.7% |
| Yup'ik | 0.0 /100 | #343 | Tragic 24.3% |
| Tohono O'odham | 0.0 /100 | #344 | Tragic 24.7% |
| Pima | 0.0 /100 | #345 | Tragic 25.3% |
| Lumbee | 0.0 /100 | #346 | Tragic 26.3% |
| Puerto Ricans | 0.0 /100 | #347 | Tragic 26.3% |
Demographics Similar to Immigrants by Female Poverty Among 25-34 Year Olds
In terms of female poverty among 25-34 year olds, the demographic groups most similar to Immigrants are Hawaiian (14.1%, a difference of 0.15%), Immigrants from Africa (14.1%, a difference of 0.19%), Welsh (14.0%, a difference of 0.41%), Immigrants from Trinidad and Tobago (14.0%, a difference of 0.46%), and Hungarian (14.1%, a difference of 0.48%).
| Demographics | Rating | Rank | Female Poverty Among 25-34 Year Olds |
| Scottish | 23.6 /100 | #196 | Fair 13.9% |
| Immigrants | Saudi Arabia | 21.9 /100 | #197 | Fair 13.9% |
| Immigrants | Germany | 20.9 /100 | #198 | Fair 13.9% |
| English | 20.4 /100 | #199 | Fair 13.9% |
| Hmong | 20.3 /100 | #200 | Fair 13.9% |
| Immigrants | Trinidad and Tobago | 17.6 /100 | #201 | Poor 14.0% |
| Welsh | 17.2 /100 | #202 | Poor 14.0% |
| Immigrants | Immigrants | 14.5 /100 | #203 | Poor 14.0% |
| Hawaiians | 13.6 /100 | #204 | Poor 14.1% |
| Immigrants | Africa | 13.4 /100 | #205 | Poor 14.1% |
| Hungarians | 11.8 /100 | #206 | Poor 14.1% |
| Japanese | 11.7 /100 | #207 | Poor 14.1% |
| Immigrants | Panama | 11.6 /100 | #208 | Poor 14.1% |
| Guyanese | 8.6 /100 | #209 | Tragic 14.2% |
| Panamanians | 8.6 /100 | #210 | Tragic 14.2% |