Haitian vs Creek Female Poverty Among 25-34 Year Olds
COMPARE
Haitian
Creek
Female Poverty Among 25-34 Year Olds
Female Poverty Among 25-34 Year Olds Comparison
Haitians
Creek
15.0%
FEMALE POVERTY AMONG 25-34 YEAR OLDS
0.5/ 100
METRIC RATING
251st/ 347
METRIC RANK
19.2%
FEMALE POVERTY AMONG 25-34 YEAR OLDS
0.0/ 100
METRIC RATING
329th/ 347
METRIC RANK
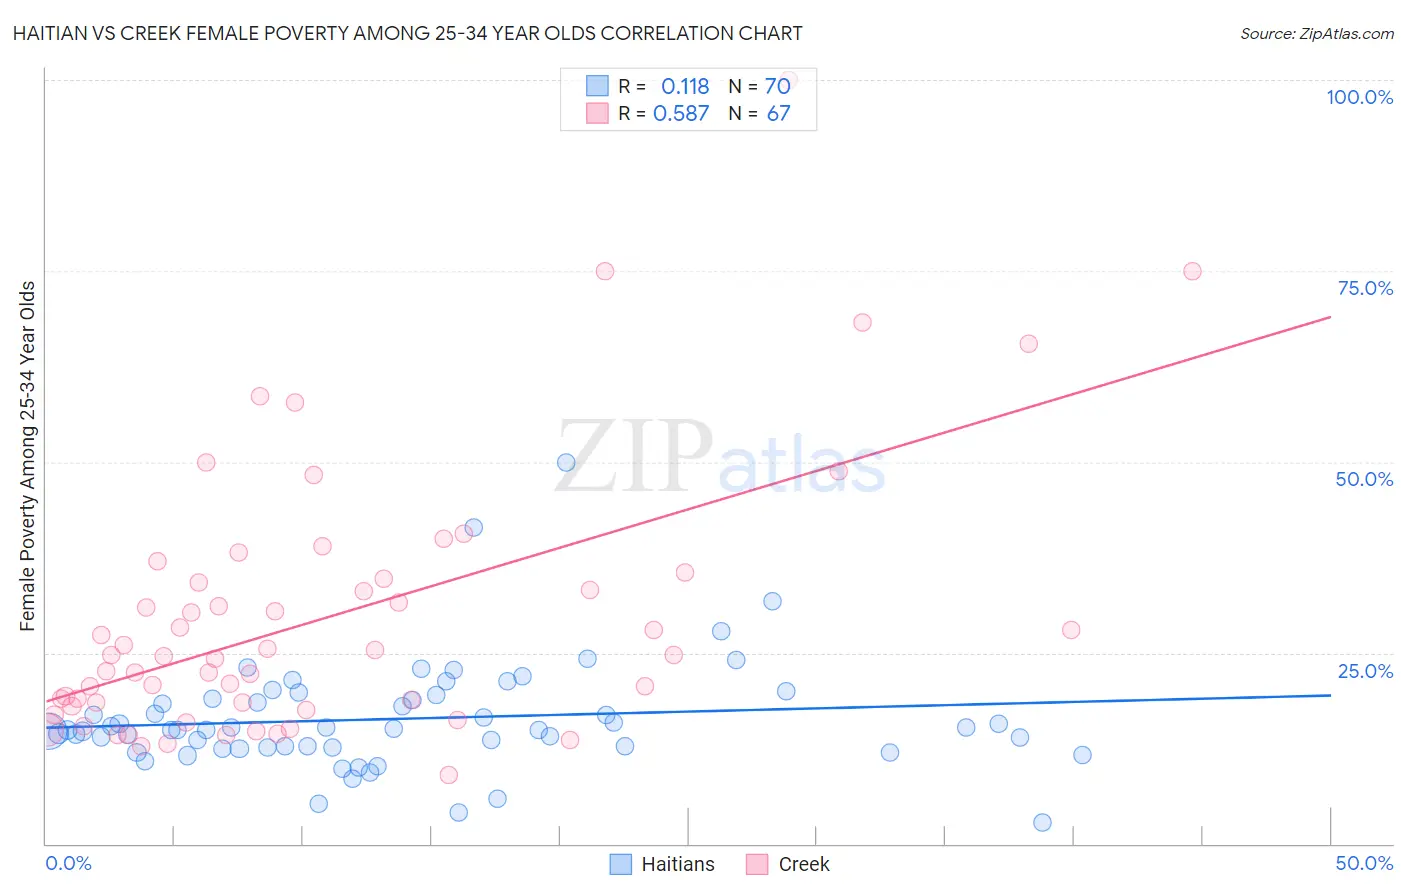
Haitian vs Creek Female Poverty Among 25-34 Year Olds Correlation Chart
The statistical analysis conducted on geographies consisting of 284,910,103 people shows a poor positive correlation between the proportion of Haitians and poverty level among females between the ages 25 and 34 in the United States with a correlation coefficient (R) of 0.118 and weighted average of 15.0%. Similarly, the statistical analysis conducted on geographies consisting of 177,502,707 people shows a substantial positive correlation between the proportion of Creek and poverty level among females between the ages 25 and 34 in the United States with a correlation coefficient (R) of 0.587 and weighted average of 19.2%, a difference of 27.4%.
Female Poverty Among 25-34 Year Olds Correlation Summary
| Measurement | Haitian | Creek |
| Minimum | 2.8% | 9.0% |
| Maximum | 50.0% | 100.0% |
| Range | 47.2% | 91.0% |
| Mean | 16.4% | 29.7% |
| Median | 14.9% | 24.7% |
| Interquartile 25% (IQ1) | 12.6% | 18.0% |
| Interquartile 75% (IQ3) | 19.1% | 34.7% |
| Interquartile Range (IQR) | 6.4% | 16.8% |
| Standard Deviation (Sample) | 7.3% | 17.6% |
| Standard Deviation (Population) | 7.2% | 17.4% |
Similar Demographics by Female Poverty Among 25-34 Year Olds
Demographics Similar to Haitians by Female Poverty Among 25-34 Year Olds
In terms of female poverty among 25-34 year olds, the demographic groups most similar to Haitians are Belizean (15.1%, a difference of 0.17%), Immigrants from El Salvador (15.0%, a difference of 0.19%), Immigrants from Haiti (15.0%, a difference of 0.22%), Immigrants from West Indies (15.1%, a difference of 0.31%), and Somali (15.1%, a difference of 0.39%).
| Demographics | Rating | Rank | Female Poverty Among 25-34 Year Olds |
| Immigrants | Bangladesh | 1.1 /100 | #244 | Tragic 14.8% |
| Immigrants | Middle Africa | 1.0 /100 | #245 | Tragic 14.8% |
| Jamaicans | 1.0 /100 | #246 | Tragic 14.8% |
| German Russians | 0.8 /100 | #247 | Tragic 14.9% |
| Immigrants | Western Africa | 0.8 /100 | #248 | Tragic 14.9% |
| Immigrants | Haiti | 0.5 /100 | #249 | Tragic 15.0% |
| Immigrants | El Salvador | 0.5 /100 | #250 | Tragic 15.0% |
| Haitians | 0.5 /100 | #251 | Tragic 15.0% |
| Belizeans | 0.4 /100 | #252 | Tragic 15.1% |
| Immigrants | West Indies | 0.4 /100 | #253 | Tragic 15.1% |
| Somalis | 0.4 /100 | #254 | Tragic 15.1% |
| Immigrants | Laos | 0.3 /100 | #255 | Tragic 15.2% |
| West Indians | 0.3 /100 | #256 | Tragic 15.2% |
| Immigrants | Burma/Myanmar | 0.3 /100 | #257 | Tragic 15.2% |
| Nepalese | 0.2 /100 | #258 | Tragic 15.2% |
Demographics Similar to Creek by Female Poverty Among 25-34 Year Olds
In terms of female poverty among 25-34 year olds, the demographic groups most similar to Creek are Alaskan Athabascan (19.1%, a difference of 0.25%), Cheyenne (19.1%, a difference of 0.33%), Black/African American (18.9%, a difference of 1.3%), Paiute (19.6%, a difference of 2.2%), and Kiowa (19.7%, a difference of 2.7%).
| Demographics | Rating | Rank | Female Poverty Among 25-34 Year Olds |
| Central American Indians | 0.0 /100 | #322 | Tragic 18.2% |
| Seminole | 0.0 /100 | #323 | Tragic 18.3% |
| Dutch West Indians | 0.0 /100 | #324 | Tragic 18.4% |
| Inupiat | 0.0 /100 | #325 | Tragic 18.5% |
| Blacks/African Americans | 0.0 /100 | #326 | Tragic 18.9% |
| Cheyenne | 0.0 /100 | #327 | Tragic 19.1% |
| Alaskan Athabascans | 0.0 /100 | #328 | Tragic 19.1% |
| Creek | 0.0 /100 | #329 | Tragic 19.2% |
| Paiute | 0.0 /100 | #330 | Tragic 19.6% |
| Kiowa | 0.0 /100 | #331 | Tragic 19.7% |
| Immigrants | Yemen | 0.0 /100 | #332 | Tragic 19.8% |
| Cajuns | 0.0 /100 | #333 | Tragic 19.9% |
| Apache | 0.0 /100 | #334 | Tragic 20.1% |
| Natives/Alaskans | 0.0 /100 | #335 | Tragic 20.3% |
| Pueblo | 0.0 /100 | #336 | Tragic 22.2% |