Haitian vs Immigrants from Thailand Female Poverty Among 25-34 Year Olds
COMPARE
Haitian
Immigrants from Thailand
Female Poverty Among 25-34 Year Olds
Female Poverty Among 25-34 Year Olds Comparison
Haitians
Immigrants from Thailand
15.0%
FEMALE POVERTY AMONG 25-34 YEAR OLDS
0.5/ 100
METRIC RATING
251st/ 347
METRIC RANK
14.3%
FEMALE POVERTY AMONG 25-34 YEAR OLDS
5.2/ 100
METRIC RATING
218th/ 347
METRIC RANK
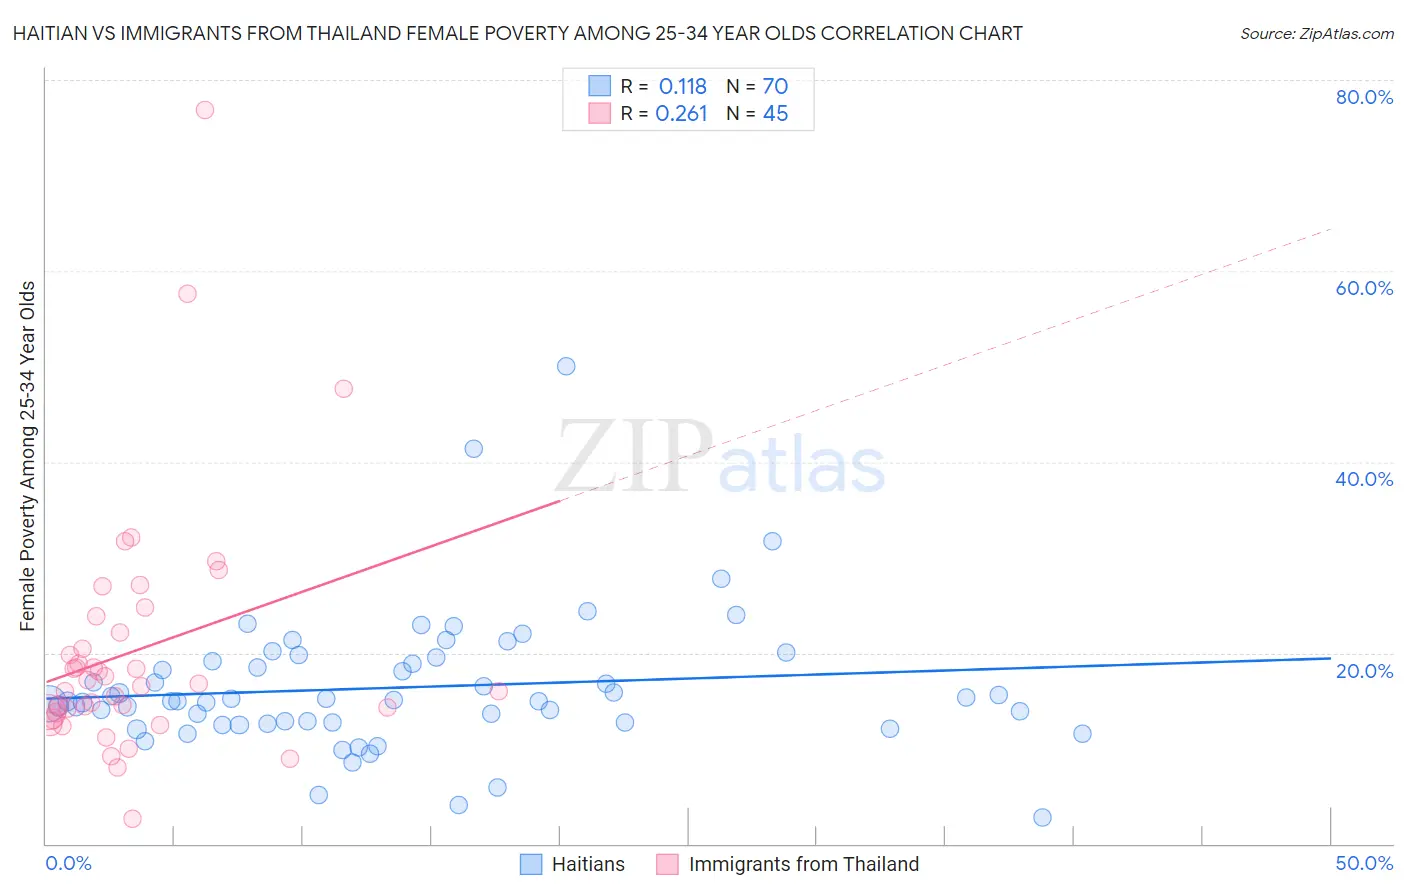
Haitian vs Immigrants from Thailand Female Poverty Among 25-34 Year Olds Correlation Chart
The statistical analysis conducted on geographies consisting of 284,910,103 people shows a poor positive correlation between the proportion of Haitians and poverty level among females between the ages 25 and 34 in the United States with a correlation coefficient (R) of 0.118 and weighted average of 15.0%. Similarly, the statistical analysis conducted on geographies consisting of 313,866,299 people shows a weak positive correlation between the proportion of Immigrants from Thailand and poverty level among females between the ages 25 and 34 in the United States with a correlation coefficient (R) of 0.261 and weighted average of 14.3%, a difference of 4.8%.
Female Poverty Among 25-34 Year Olds Correlation Summary
| Measurement | Haitian | Immigrants from Thailand |
| Minimum | 2.8% | 2.6% |
| Maximum | 50.0% | 76.9% |
| Range | 47.2% | 74.3% |
| Mean | 16.4% | 20.2% |
| Median | 14.9% | 16.7% |
| Interquartile 25% (IQ1) | 12.6% | 13.8% |
| Interquartile 75% (IQ3) | 19.1% | 23.0% |
| Interquartile Range (IQR) | 6.4% | 9.2% |
| Standard Deviation (Sample) | 7.3% | 13.0% |
| Standard Deviation (Population) | 7.2% | 12.9% |
Similar Demographics by Female Poverty Among 25-34 Year Olds
Demographics Similar to Haitians by Female Poverty Among 25-34 Year Olds
In terms of female poverty among 25-34 year olds, the demographic groups most similar to Haitians are Belizean (15.1%, a difference of 0.17%), Immigrants from El Salvador (15.0%, a difference of 0.19%), Immigrants from Haiti (15.0%, a difference of 0.22%), Immigrants from West Indies (15.1%, a difference of 0.31%), and Somali (15.1%, a difference of 0.39%).
| Demographics | Rating | Rank | Female Poverty Among 25-34 Year Olds |
| Immigrants | Bangladesh | 1.1 /100 | #244 | Tragic 14.8% |
| Immigrants | Middle Africa | 1.0 /100 | #245 | Tragic 14.8% |
| Jamaicans | 1.0 /100 | #246 | Tragic 14.8% |
| German Russians | 0.8 /100 | #247 | Tragic 14.9% |
| Immigrants | Western Africa | 0.8 /100 | #248 | Tragic 14.9% |
| Immigrants | Haiti | 0.5 /100 | #249 | Tragic 15.0% |
| Immigrants | El Salvador | 0.5 /100 | #250 | Tragic 15.0% |
| Haitians | 0.5 /100 | #251 | Tragic 15.0% |
| Belizeans | 0.4 /100 | #252 | Tragic 15.1% |
| Immigrants | West Indies | 0.4 /100 | #253 | Tragic 15.1% |
| Somalis | 0.4 /100 | #254 | Tragic 15.1% |
| Immigrants | Laos | 0.3 /100 | #255 | Tragic 15.2% |
| West Indians | 0.3 /100 | #256 | Tragic 15.2% |
| Immigrants | Burma/Myanmar | 0.3 /100 | #257 | Tragic 15.2% |
| Nepalese | 0.2 /100 | #258 | Tragic 15.2% |
Demographics Similar to Immigrants from Thailand by Female Poverty Among 25-34 Year Olds
In terms of female poverty among 25-34 year olds, the demographic groups most similar to Immigrants from Thailand are Ecuadorian (14.3%, a difference of 0.0%), French Canadian (14.3%, a difference of 0.11%), Spanish American Indian (14.3%, a difference of 0.11%), Ghanaian (14.4%, a difference of 0.17%), and Sudanese (14.4%, a difference of 0.32%).
| Demographics | Rating | Rank | Female Poverty Among 25-34 Year Olds |
| Trinidadians and Tobagonians | 8.2 /100 | #211 | Tragic 14.2% |
| Immigrants | Guyana | 6.6 /100 | #212 | Tragic 14.3% |
| Puget Sound Salish | 6.5 /100 | #213 | Tragic 14.3% |
| French | 6.2 /100 | #214 | Tragic 14.3% |
| Immigrants | Nigeria | 6.2 /100 | #215 | Tragic 14.3% |
| French Canadians | 5.5 /100 | #216 | Tragic 14.3% |
| Spanish American Indians | 5.5 /100 | #217 | Tragic 14.3% |
| Immigrants | Thailand | 5.2 /100 | #218 | Tragic 14.3% |
| Ecuadorians | 5.2 /100 | #219 | Tragic 14.3% |
| Ghanaians | 4.8 /100 | #220 | Tragic 14.4% |
| Sudanese | 4.4 /100 | #221 | Tragic 14.4% |
| Immigrants | Portugal | 4.3 /100 | #222 | Tragic 14.4% |
| Nigerians | 4.2 /100 | #223 | Tragic 14.4% |
| Immigrants | Sudan | 4.0 /100 | #224 | Tragic 14.4% |
| Immigrants | Barbados | 3.4 /100 | #225 | Tragic 14.5% |