Haitian vs Immigrants from Serbia Female Poverty Among 25-34 Year Olds
COMPARE
Haitian
Immigrants from Serbia
Female Poverty Among 25-34 Year Olds
Female Poverty Among 25-34 Year Olds Comparison
Haitians
Immigrants from Serbia
15.0%
FEMALE POVERTY AMONG 25-34 YEAR OLDS
0.5/ 100
METRIC RATING
251st/ 347
METRIC RANK
11.9%
FEMALE POVERTY AMONG 25-34 YEAR OLDS
99.7/ 100
METRIC RATING
46th/ 347
METRIC RANK
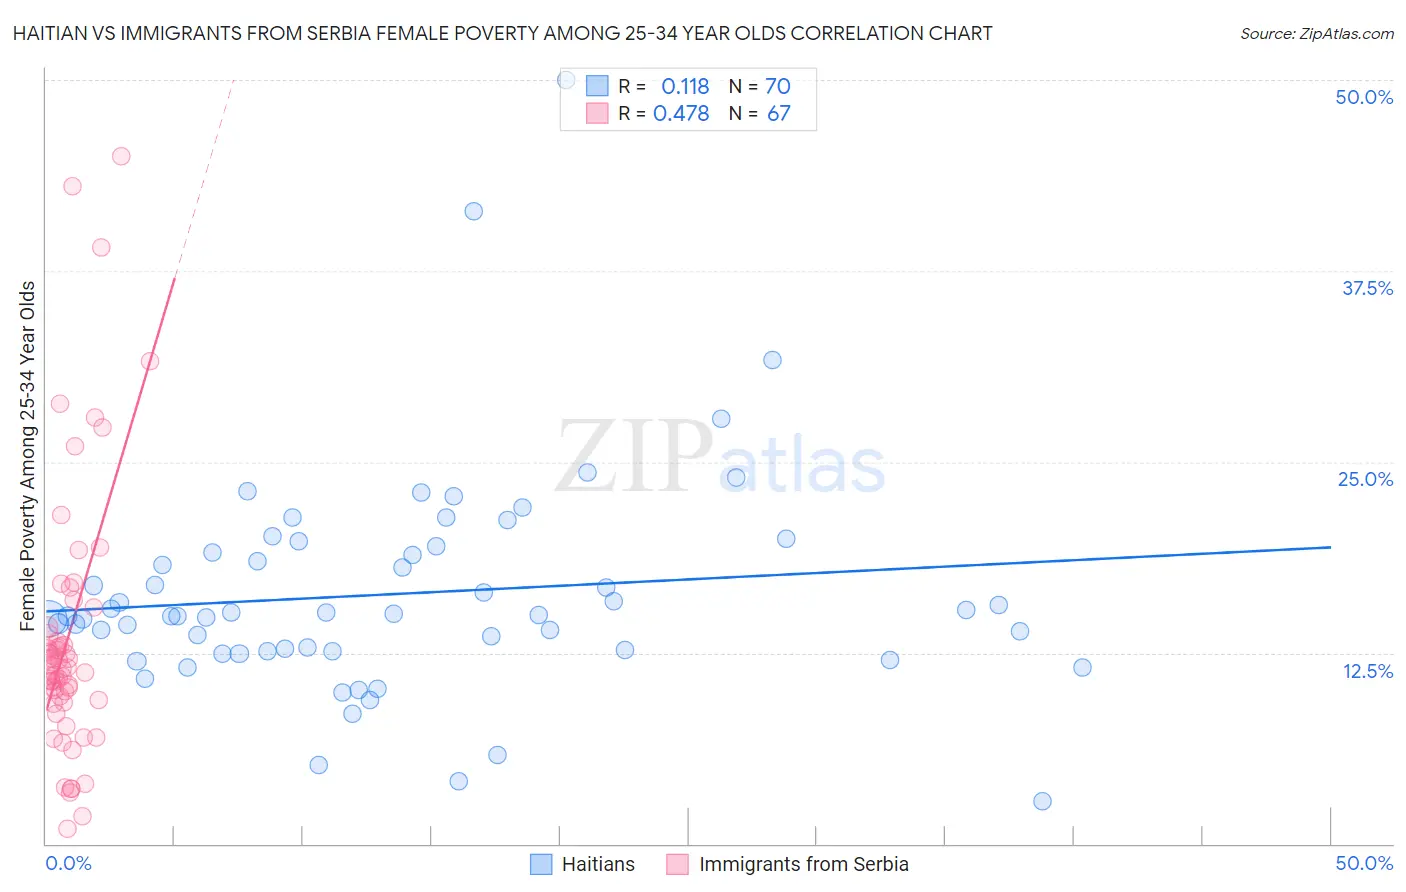
Haitian vs Immigrants from Serbia Female Poverty Among 25-34 Year Olds Correlation Chart
The statistical analysis conducted on geographies consisting of 284,910,103 people shows a poor positive correlation between the proportion of Haitians and poverty level among females between the ages 25 and 34 in the United States with a correlation coefficient (R) of 0.118 and weighted average of 15.0%. Similarly, the statistical analysis conducted on geographies consisting of 130,855,081 people shows a moderate positive correlation between the proportion of Immigrants from Serbia and poverty level among females between the ages 25 and 34 in the United States with a correlation coefficient (R) of 0.478 and weighted average of 11.9%, a difference of 25.9%.
Female Poverty Among 25-34 Year Olds Correlation Summary
| Measurement | Haitian | Immigrants from Serbia |
| Minimum | 2.8% | 0.98% |
| Maximum | 50.0% | 45.0% |
| Range | 47.2% | 44.0% |
| Mean | 16.4% | 13.5% |
| Median | 14.9% | 11.5% |
| Interquartile 25% (IQ1) | 12.6% | 9.4% |
| Interquartile 75% (IQ3) | 19.1% | 14.2% |
| Interquartile Range (IQR) | 6.4% | 4.7% |
| Standard Deviation (Sample) | 7.3% | 8.8% |
| Standard Deviation (Population) | 7.2% | 8.7% |
Similar Demographics by Female Poverty Among 25-34 Year Olds
Demographics Similar to Haitians by Female Poverty Among 25-34 Year Olds
In terms of female poverty among 25-34 year olds, the demographic groups most similar to Haitians are Belizean (15.1%, a difference of 0.17%), Immigrants from El Salvador (15.0%, a difference of 0.19%), Immigrants from Haiti (15.0%, a difference of 0.22%), Immigrants from West Indies (15.1%, a difference of 0.31%), and Somali (15.1%, a difference of 0.39%).
| Demographics | Rating | Rank | Female Poverty Among 25-34 Year Olds |
| Immigrants | Bangladesh | 1.1 /100 | #244 | Tragic 14.8% |
| Immigrants | Middle Africa | 1.0 /100 | #245 | Tragic 14.8% |
| Jamaicans | 1.0 /100 | #246 | Tragic 14.8% |
| German Russians | 0.8 /100 | #247 | Tragic 14.9% |
| Immigrants | Western Africa | 0.8 /100 | #248 | Tragic 14.9% |
| Immigrants | Haiti | 0.5 /100 | #249 | Tragic 15.0% |
| Immigrants | El Salvador | 0.5 /100 | #250 | Tragic 15.0% |
| Haitians | 0.5 /100 | #251 | Tragic 15.0% |
| Belizeans | 0.4 /100 | #252 | Tragic 15.1% |
| Immigrants | West Indies | 0.4 /100 | #253 | Tragic 15.1% |
| Somalis | 0.4 /100 | #254 | Tragic 15.1% |
| Immigrants | Laos | 0.3 /100 | #255 | Tragic 15.2% |
| West Indians | 0.3 /100 | #256 | Tragic 15.2% |
| Immigrants | Burma/Myanmar | 0.3 /100 | #257 | Tragic 15.2% |
| Nepalese | 0.2 /100 | #258 | Tragic 15.2% |
Demographics Similar to Immigrants from Serbia by Female Poverty Among 25-34 Year Olds
In terms of female poverty among 25-34 year olds, the demographic groups most similar to Immigrants from Serbia are Macedonian (11.9%, a difference of 0.010%), Korean (12.0%, a difference of 0.16%), Immigrants from Belarus (12.0%, a difference of 0.22%), Immigrants from Australia (11.9%, a difference of 0.27%), and Egyptian (11.9%, a difference of 0.29%).
| Demographics | Rating | Rank | Female Poverty Among 25-34 Year Olds |
| Latvians | 99.8 /100 | #39 | Exceptional 11.8% |
| Immigrants | Bulgaria | 99.8 /100 | #40 | Exceptional 11.8% |
| Immigrants | Indonesia | 99.8 /100 | #41 | Exceptional 11.8% |
| Immigrants | Turkey | 99.7 /100 | #42 | Exceptional 11.9% |
| Egyptians | 99.7 /100 | #43 | Exceptional 11.9% |
| Immigrants | Australia | 99.7 /100 | #44 | Exceptional 11.9% |
| Macedonians | 99.7 /100 | #45 | Exceptional 11.9% |
| Immigrants | Serbia | 99.7 /100 | #46 | Exceptional 11.9% |
| Koreans | 99.6 /100 | #47 | Exceptional 12.0% |
| Immigrants | Belarus | 99.6 /100 | #48 | Exceptional 12.0% |
| Immigrants | Egypt | 99.6 /100 | #49 | Exceptional 12.0% |
| Immigrants | Croatia | 99.6 /100 | #50 | Exceptional 12.0% |
| Paraguayans | 99.6 /100 | #51 | Exceptional 12.0% |
| Immigrants | Eastern Europe | 99.6 /100 | #52 | Exceptional 12.0% |
| Immigrants | Israel | 99.6 /100 | #53 | Exceptional 12.0% |