Zimbabwean vs Immigrants Female Poverty Among 25-34 Year Olds
COMPARE
Zimbabwean
Immigrants
Female Poverty Among 25-34 Year Olds
Female Poverty Among 25-34 Year Olds Comparison
Zimbabweans
Immigrants
11.7%
FEMALE POVERTY AMONG 25-34 YEAR OLDS
99.9/ 100
METRIC RATING
34th/ 347
METRIC RANK
14.0%
FEMALE POVERTY AMONG 25-34 YEAR OLDS
14.5/ 100
METRIC RATING
203rd/ 347
METRIC RANK
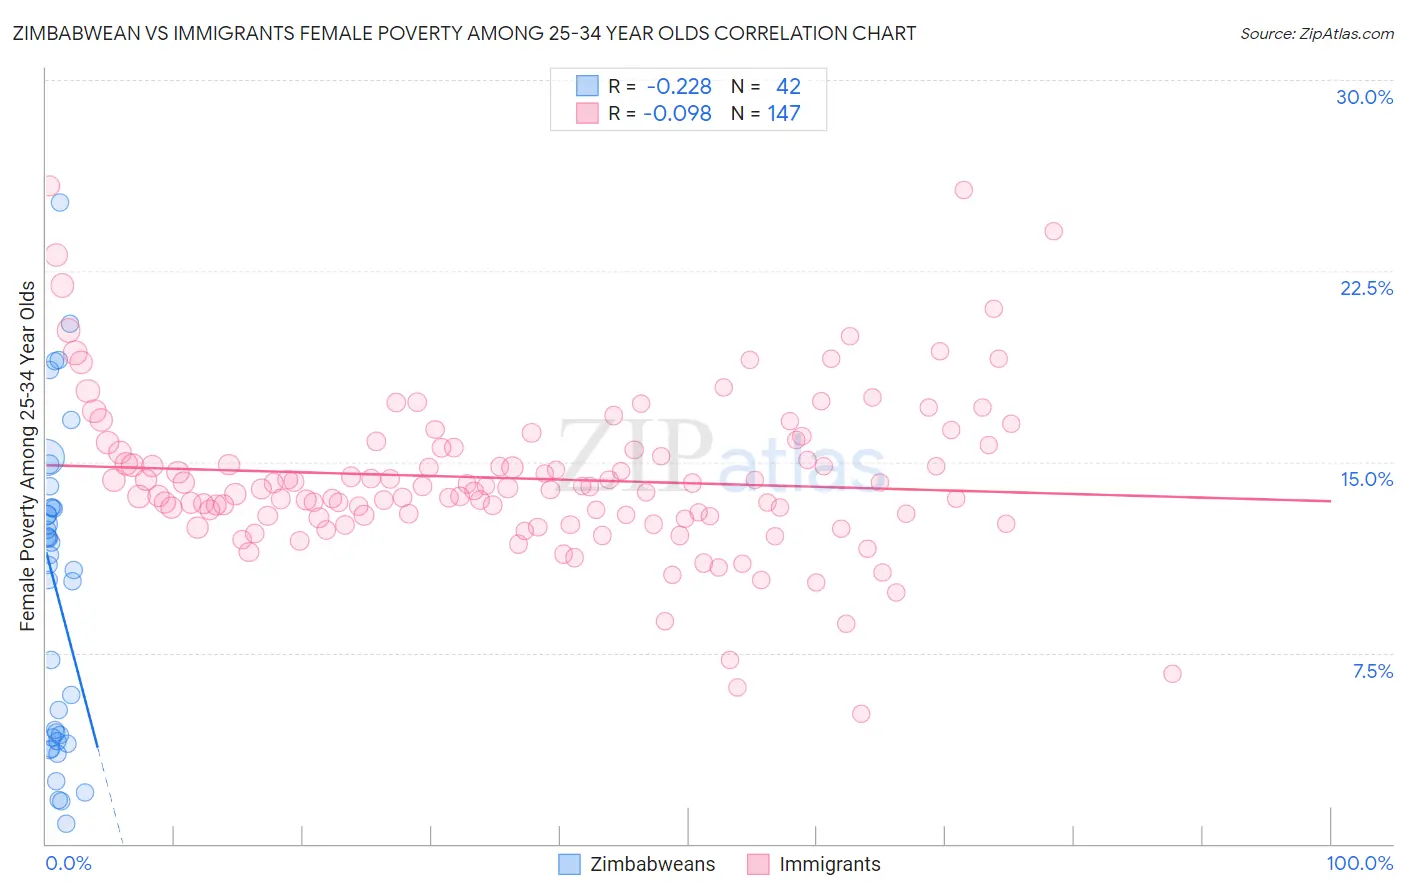
Zimbabwean vs Immigrants Female Poverty Among 25-34 Year Olds Correlation Chart
The statistical analysis conducted on geographies consisting of 69,074,589 people shows a weak negative correlation between the proportion of Zimbabweans and poverty level among females between the ages 25 and 34 in the United States with a correlation coefficient (R) of -0.228 and weighted average of 11.7%. Similarly, the statistical analysis conducted on geographies consisting of 554,833,971 people shows a slight negative correlation between the proportion of Immigrants and poverty level among females between the ages 25 and 34 in the United States with a correlation coefficient (R) of -0.098 and weighted average of 14.0%, a difference of 20.3%.
Female Poverty Among 25-34 Year Olds Correlation Summary
| Measurement | Zimbabwean | Immigrants |
| Minimum | 0.80% | 5.1% |
| Maximum | 25.2% | 25.8% |
| Range | 24.4% | 20.7% |
| Mean | 10.0% | 14.3% |
| Median | 11.2% | 14.0% |
| Interquartile 25% (IQ1) | 4.2% | 12.9% |
| Interquartile 75% (IQ3) | 13.2% | 15.5% |
| Interquartile Range (IQR) | 9.0% | 2.7% |
| Standard Deviation (Sample) | 6.0% | 3.2% |
| Standard Deviation (Population) | 5.9% | 3.2% |
Similar Demographics by Female Poverty Among 25-34 Year Olds
Demographics Similar to Zimbabweans by Female Poverty Among 25-34 Year Olds
In terms of female poverty among 25-34 year olds, the demographic groups most similar to Zimbabweans are Immigrants from Poland (11.6%, a difference of 0.22%), Cambodian (11.7%, a difference of 0.27%), Immigrants from Asia (11.6%, a difference of 0.57%), Immigrants from Sri Lanka (11.8%, a difference of 0.76%), and Immigrants from Japan (11.6%, a difference of 0.87%).
| Demographics | Rating | Rank | Female Poverty Among 25-34 Year Olds |
| Immigrants | Greece | 99.9 /100 | #27 | Exceptional 11.5% |
| Immigrants | Pakistan | 99.9 /100 | #28 | Exceptional 11.5% |
| Bulgarians | 99.9 /100 | #29 | Exceptional 11.5% |
| Cypriots | 99.9 /100 | #30 | Exceptional 11.5% |
| Immigrants | Japan | 99.9 /100 | #31 | Exceptional 11.6% |
| Immigrants | Asia | 99.9 /100 | #32 | Exceptional 11.6% |
| Immigrants | Poland | 99.9 /100 | #33 | Exceptional 11.6% |
| Zimbabweans | 99.9 /100 | #34 | Exceptional 11.7% |
| Cambodians | 99.9 /100 | #35 | Exceptional 11.7% |
| Immigrants | Sri Lanka | 99.8 /100 | #36 | Exceptional 11.8% |
| Taiwanese | 99.8 /100 | #37 | Exceptional 11.8% |
| Immigrants | North Macedonia | 99.8 /100 | #38 | Exceptional 11.8% |
| Latvians | 99.8 /100 | #39 | Exceptional 11.8% |
| Immigrants | Bulgaria | 99.8 /100 | #40 | Exceptional 11.8% |
| Immigrants | Indonesia | 99.8 /100 | #41 | Exceptional 11.8% |
Demographics Similar to Immigrants by Female Poverty Among 25-34 Year Olds
In terms of female poverty among 25-34 year olds, the demographic groups most similar to Immigrants are Hawaiian (14.1%, a difference of 0.15%), Immigrants from Africa (14.1%, a difference of 0.19%), Welsh (14.0%, a difference of 0.41%), Immigrants from Trinidad and Tobago (14.0%, a difference of 0.46%), and Hungarian (14.1%, a difference of 0.48%).
| Demographics | Rating | Rank | Female Poverty Among 25-34 Year Olds |
| Scottish | 23.6 /100 | #196 | Fair 13.9% |
| Immigrants | Saudi Arabia | 21.9 /100 | #197 | Fair 13.9% |
| Immigrants | Germany | 20.9 /100 | #198 | Fair 13.9% |
| English | 20.4 /100 | #199 | Fair 13.9% |
| Hmong | 20.3 /100 | #200 | Fair 13.9% |
| Immigrants | Trinidad and Tobago | 17.6 /100 | #201 | Poor 14.0% |
| Welsh | 17.2 /100 | #202 | Poor 14.0% |
| Immigrants | Immigrants | 14.5 /100 | #203 | Poor 14.0% |
| Hawaiians | 13.6 /100 | #204 | Poor 14.1% |
| Immigrants | Africa | 13.4 /100 | #205 | Poor 14.1% |
| Hungarians | 11.8 /100 | #206 | Poor 14.1% |
| Japanese | 11.7 /100 | #207 | Poor 14.1% |
| Immigrants | Panama | 11.6 /100 | #208 | Poor 14.1% |
| Guyanese | 8.6 /100 | #209 | Tragic 14.2% |
| Panamanians | 8.6 /100 | #210 | Tragic 14.2% |