Immigrants from Canada vs Venezuelan Family Poverty
COMPARE
Immigrants from Canada
Venezuelan
Family Poverty
Family Poverty Comparison
Immigrants from Canada
Venezuelans
7.8%
FAMILY POVERTY
98.2/ 100
METRIC RATING
70th/ 347
METRIC RANK
9.3%
FAMILY POVERTY
27.4/ 100
METRIC RATING
195th/ 347
METRIC RANK
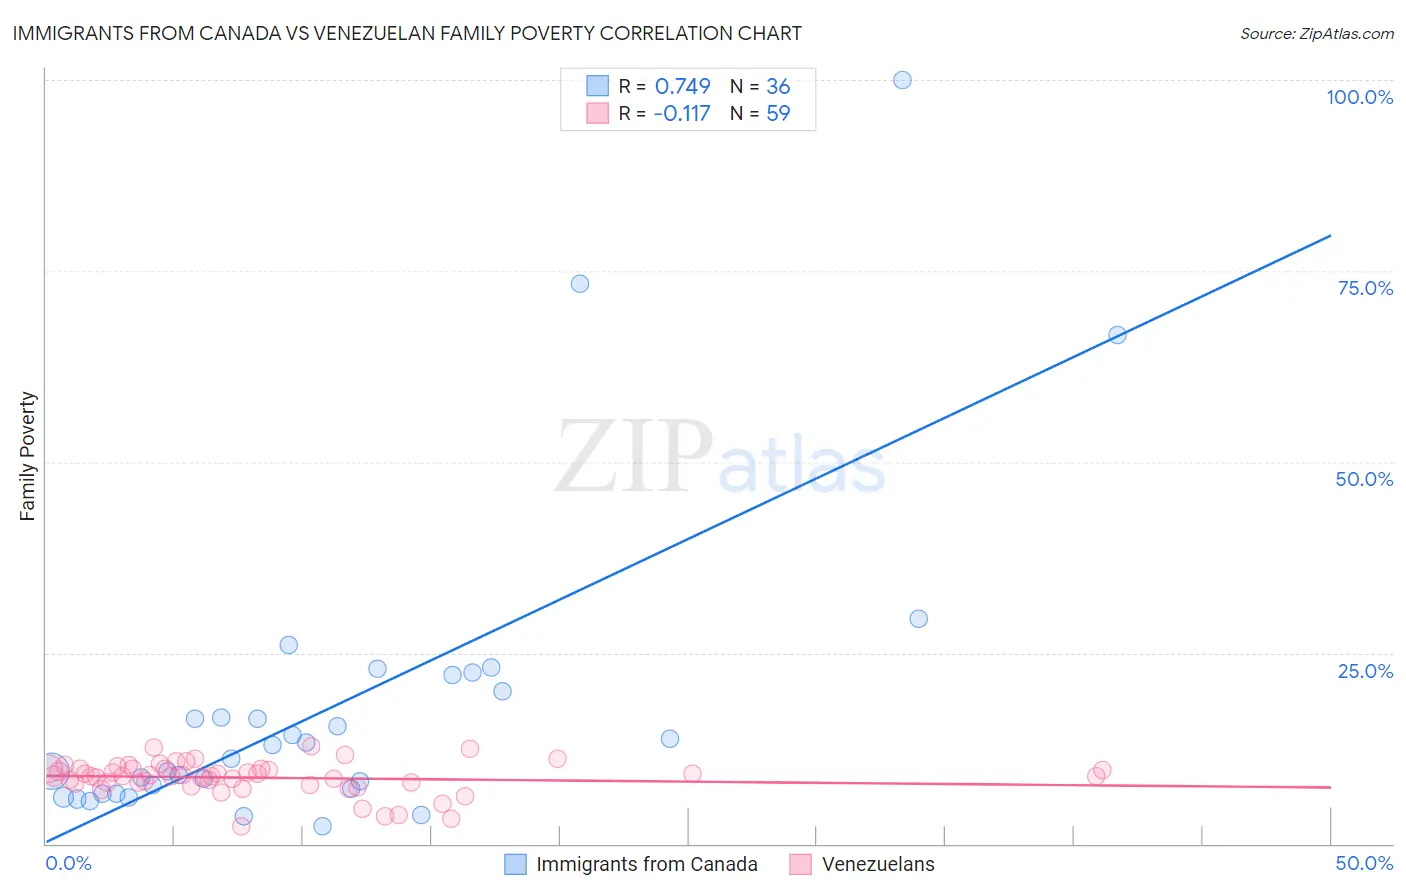
Immigrants from Canada vs Venezuelan Family Poverty Correlation Chart
The statistical analysis conducted on geographies consisting of 457,293,796 people shows a strong positive correlation between the proportion of Immigrants from Canada and poverty level among families in the United States with a correlation coefficient (R) of 0.749 and weighted average of 7.8%. Similarly, the statistical analysis conducted on geographies consisting of 305,744,356 people shows a poor negative correlation between the proportion of Venezuelans and poverty level among families in the United States with a correlation coefficient (R) of -0.117 and weighted average of 9.3%, a difference of 18.8%.
Family Poverty Correlation Summary
| Measurement | Immigrants from Canada | Venezuelan |
| Minimum | 2.3% | 2.3% |
| Maximum | 100.0% | 12.8% |
| Range | 97.7% | 10.5% |
| Mean | 18.1% | 8.6% |
| Median | 12.1% | 8.9% |
| Interquartile 25% (IQ1) | 6.9% | 7.8% |
| Interquartile 75% (IQ3) | 21.0% | 9.9% |
| Interquartile Range (IQR) | 14.2% | 2.0% |
| Standard Deviation (Sample) | 20.6% | 2.2% |
| Standard Deviation (Population) | 20.3% | 2.1% |
Similar Demographics by Family Poverty
Demographics Similar to Immigrants from Canada by Family Poverty
In terms of family poverty, the demographic groups most similar to Immigrants from Canada are Cambodian (7.8%, a difference of 0.020%), Immigrants from Belgium (7.8%, a difference of 0.040%), Australian (7.8%, a difference of 0.060%), Immigrants from Romania (7.8%, a difference of 0.080%), and Austrian (7.8%, a difference of 0.080%).
| Demographics | Rating | Rank | Family Poverty |
| Zimbabweans | 98.4 /100 | #63 | Exceptional 7.8% |
| Koreans | 98.3 /100 | #64 | Exceptional 7.8% |
| Immigrants | Bulgaria | 98.3 /100 | #65 | Exceptional 7.8% |
| Dutch | 98.3 /100 | #66 | Exceptional 7.8% |
| Northern Europeans | 98.3 /100 | #67 | Exceptional 7.8% |
| Australians | 98.2 /100 | #68 | Exceptional 7.8% |
| Immigrants | Belgium | 98.2 /100 | #69 | Exceptional 7.8% |
| Immigrants | Canada | 98.2 /100 | #70 | Exceptional 7.8% |
| Cambodians | 98.2 /100 | #71 | Exceptional 7.8% |
| Immigrants | Romania | 98.2 /100 | #72 | Exceptional 7.8% |
| Austrians | 98.2 /100 | #73 | Exceptional 7.8% |
| Immigrants | China | 98.1 /100 | #74 | Exceptional 7.8% |
| Immigrants | Croatia | 98.1 /100 | #75 | Exceptional 7.8% |
| Immigrants | Latvia | 98.0 /100 | #76 | Exceptional 7.9% |
| Ukrainians | 98.0 /100 | #77 | Exceptional 7.9% |
Demographics Similar to Venezuelans by Family Poverty
In terms of family poverty, the demographic groups most similar to Venezuelans are South American (9.3%, a difference of 0.12%), Immigrants from Western Asia (9.3%, a difference of 0.13%), Spanish (9.3%, a difference of 0.21%), Immigrants from Venezuela (9.3%, a difference of 0.21%), and Ugandan (9.3%, a difference of 0.22%).
| Demographics | Rating | Rank | Family Poverty |
| Immigrants | Kenya | 34.0 /100 | #188 | Fair 9.2% |
| Immigrants | Afghanistan | 32.1 /100 | #189 | Fair 9.2% |
| Arabs | 31.5 /100 | #190 | Fair 9.2% |
| Ugandans | 28.7 /100 | #191 | Fair 9.3% |
| Spanish | 28.7 /100 | #192 | Fair 9.3% |
| Immigrants | Western Asia | 28.2 /100 | #193 | Fair 9.3% |
| South Americans | 28.1 /100 | #194 | Fair 9.3% |
| Venezuelans | 27.4 /100 | #195 | Fair 9.3% |
| Immigrants | Venezuela | 26.1 /100 | #196 | Fair 9.3% |
| Immigrants | Colombia | 24.4 /100 | #197 | Fair 9.3% |
| Iraqis | 24.2 /100 | #198 | Fair 9.3% |
| Spaniards | 22.8 /100 | #199 | Fair 9.4% |
| Immigrants | Costa Rica | 21.7 /100 | #200 | Fair 9.4% |
| Immigrants | Portugal | 20.5 /100 | #201 | Fair 9.4% |
| Immigrants | Sierra Leone | 19.6 /100 | #202 | Poor 9.4% |