Guyanese vs Venezuelan Child Poverty Among Boys Under 16
COMPARE
Guyanese
Venezuelan
Child Poverty Among Boys Under 16
Child Poverty Among Boys Under 16 Comparison
Guyanese
Venezuelans
19.6%
CHILD POVERTY AMONG BOYS UNDER 16
0.1/ 100
METRIC RATING
265th/ 347
METRIC RANK
15.7%
CHILD POVERTY AMONG BOYS UNDER 16
82.1/ 100
METRIC RATING
147th/ 347
METRIC RANK
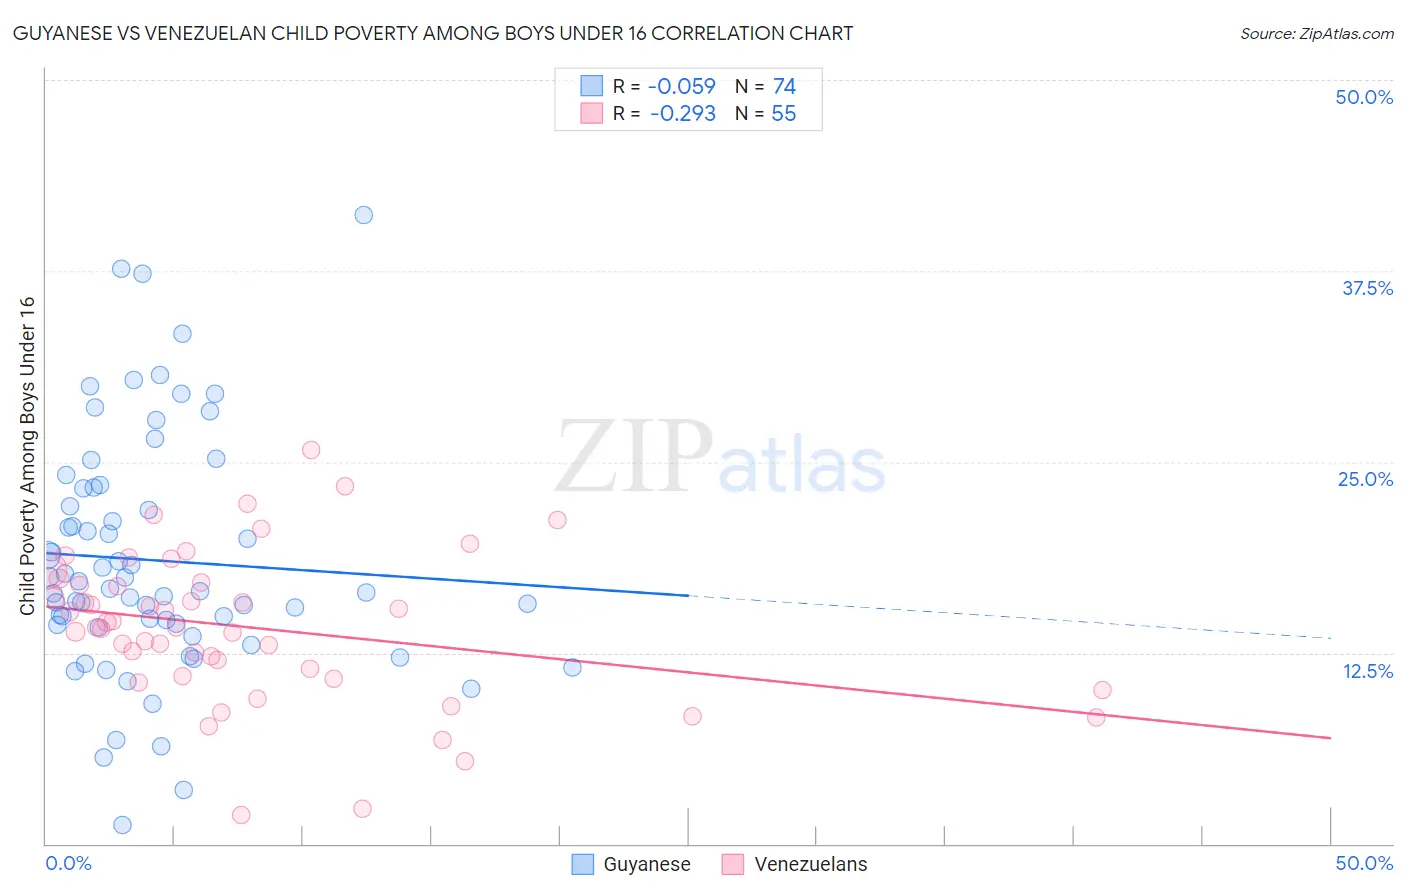
Guyanese vs Venezuelan Child Poverty Among Boys Under 16 Correlation Chart
The statistical analysis conducted on geographies consisting of 175,314,590 people shows a slight negative correlation between the proportion of Guyanese and poverty level among boys under the age of 16 in the United States with a correlation coefficient (R) of -0.059 and weighted average of 19.6%. Similarly, the statistical analysis conducted on geographies consisting of 302,859,424 people shows a weak negative correlation between the proportion of Venezuelans and poverty level among boys under the age of 16 in the United States with a correlation coefficient (R) of -0.293 and weighted average of 15.7%, a difference of 24.5%.
Child Poverty Among Boys Under 16 Correlation Summary
| Measurement | Guyanese | Venezuelan |
| Minimum | 1.2% | 1.9% |
| Maximum | 41.2% | 25.8% |
| Range | 39.9% | 23.9% |
| Mean | 18.6% | 14.2% |
| Median | 16.6% | 14.2% |
| Interquartile 25% (IQ1) | 14.3% | 11.0% |
| Interquartile 75% (IQ3) | 23.3% | 17.1% |
| Interquartile Range (IQR) | 9.0% | 6.1% |
| Standard Deviation (Sample) | 7.8% | 4.9% |
| Standard Deviation (Population) | 7.8% | 4.9% |
Similar Demographics by Child Poverty Among Boys Under 16
Demographics Similar to Guyanese by Child Poverty Among Boys Under 16
In terms of child poverty among boys under 16, the demographic groups most similar to Guyanese are Immigrants from El Salvador (19.6%, a difference of 0.040%), Vietnamese (19.6%, a difference of 0.060%), Iroquois (19.6%, a difference of 0.090%), Spanish American Indian (19.6%, a difference of 0.17%), and Ottawa (19.5%, a difference of 0.32%).
| Demographics | Rating | Rank | Child Poverty Among Boys Under 16 |
| Potawatomi | 0.2 /100 | #258 | Tragic 19.4% |
| Spanish Americans | 0.2 /100 | #259 | Tragic 19.4% |
| Shoshone | 0.2 /100 | #260 | Tragic 19.4% |
| Immigrants | Ghana | 0.2 /100 | #261 | Tragic 19.4% |
| Immigrants | Guyana | 0.1 /100 | #262 | Tragic 19.5% |
| Ottawa | 0.1 /100 | #263 | Tragic 19.5% |
| Iroquois | 0.1 /100 | #264 | Tragic 19.6% |
| Guyanese | 0.1 /100 | #265 | Tragic 19.6% |
| Immigrants | El Salvador | 0.1 /100 | #266 | Tragic 19.6% |
| Vietnamese | 0.1 /100 | #267 | Tragic 19.6% |
| Spanish American Indians | 0.1 /100 | #268 | Tragic 19.6% |
| Immigrants | Cabo Verde | 0.1 /100 | #269 | Tragic 19.7% |
| Cherokee | 0.1 /100 | #270 | Tragic 19.7% |
| Chickasaw | 0.1 /100 | #271 | Tragic 19.8% |
| Immigrants | Ecuador | 0.1 /100 | #272 | Tragic 19.8% |
Demographics Similar to Venezuelans by Child Poverty Among Boys Under 16
In terms of child poverty among boys under 16, the demographic groups most similar to Venezuelans are New Zealander (15.7%, a difference of 0.070%), Brazilian (15.8%, a difference of 0.20%), Samoan (15.7%, a difference of 0.22%), Immigrants from Peru (15.7%, a difference of 0.28%), and Immigrants from Fiji (15.7%, a difference of 0.30%).
| Demographics | Rating | Rank | Child Poverty Among Boys Under 16 |
| Immigrants | Kuwait | 85.6 /100 | #140 | Excellent 15.6% |
| Slavs | 84.5 /100 | #141 | Excellent 15.7% |
| Immigrants | Hungary | 84.1 /100 | #142 | Excellent 15.7% |
| Immigrants | Fiji | 83.6 /100 | #143 | Excellent 15.7% |
| Immigrants | Peru | 83.5 /100 | #144 | Excellent 15.7% |
| Samoans | 83.2 /100 | #145 | Excellent 15.7% |
| New Zealanders | 82.4 /100 | #146 | Excellent 15.7% |
| Venezuelans | 82.1 /100 | #147 | Excellent 15.7% |
| Brazilians | 81.0 /100 | #148 | Excellent 15.8% |
| Slovaks | 80.3 /100 | #149 | Excellent 15.8% |
| Immigrants | Jordan | 80.2 /100 | #150 | Excellent 15.8% |
| Puget Sound Salish | 79.8 /100 | #151 | Good 15.8% |
| Immigrants | Venezuela | 79.5 /100 | #152 | Good 15.8% |
| French | 78.7 /100 | #153 | Good 15.8% |
| Syrians | 77.5 /100 | #154 | Good 15.9% |