Immigrants from Bolivia vs Venezuelan Family Poverty
COMPARE
Immigrants from Bolivia
Venezuelan
Family Poverty
Family Poverty Comparison
Immigrants from Bolivia
Venezuelans
7.7%
FAMILY POVERTY
98.9/ 100
METRIC RATING
49th/ 347
METRIC RANK
9.3%
FAMILY POVERTY
27.4/ 100
METRIC RATING
195th/ 347
METRIC RANK
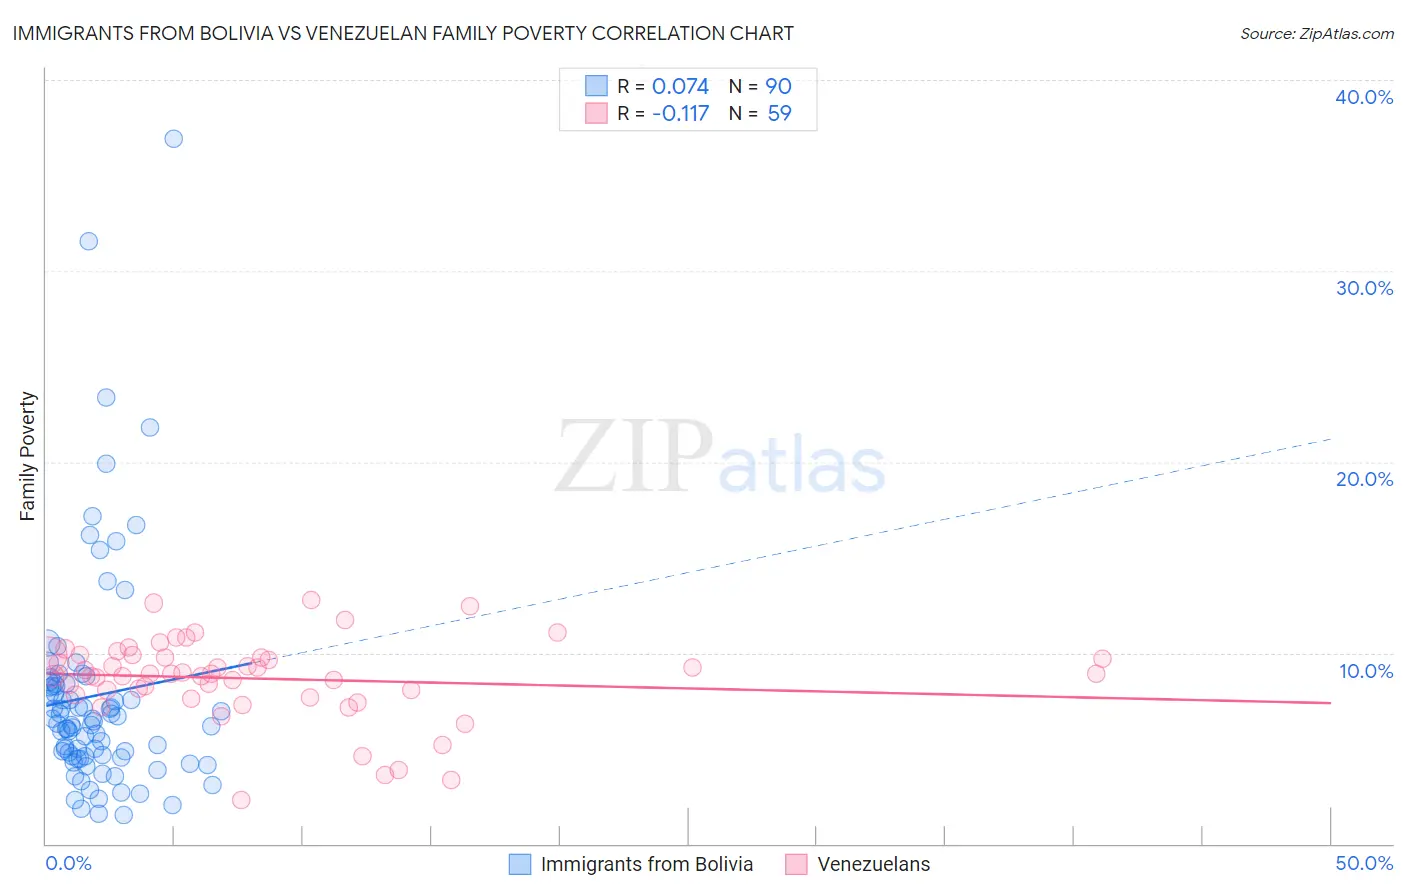
Immigrants from Bolivia vs Venezuelan Family Poverty Correlation Chart
The statistical analysis conducted on geographies consisting of 158,596,723 people shows a slight positive correlation between the proportion of Immigrants from Bolivia and poverty level among families in the United States with a correlation coefficient (R) of 0.074 and weighted average of 7.7%. Similarly, the statistical analysis conducted on geographies consisting of 305,744,356 people shows a poor negative correlation between the proportion of Venezuelans and poverty level among families in the United States with a correlation coefficient (R) of -0.117 and weighted average of 9.3%, a difference of 20.9%.
Family Poverty Correlation Summary
| Measurement | Immigrants from Bolivia | Venezuelan |
| Minimum | 1.5% | 2.3% |
| Maximum | 36.9% | 12.8% |
| Range | 35.4% | 10.5% |
| Mean | 7.8% | 8.6% |
| Median | 6.4% | 8.9% |
| Interquartile 25% (IQ1) | 4.6% | 7.8% |
| Interquartile 75% (IQ3) | 8.4% | 9.9% |
| Interquartile Range (IQR) | 3.8% | 2.0% |
| Standard Deviation (Sample) | 5.9% | 2.2% |
| Standard Deviation (Population) | 5.9% | 2.1% |
Similar Demographics by Family Poverty
Demographics Similar to Immigrants from Bolivia by Family Poverty
In terms of family poverty, the demographic groups most similar to Immigrants from Bolivia are Immigrants from North Macedonia (7.7%, a difference of 0.030%), Immigrants from Moldova (7.7%, a difference of 0.18%), Immigrants from Sri Lanka (7.7%, a difference of 0.19%), Immigrants from Czechoslovakia (7.7%, a difference of 0.20%), and Tongan (7.7%, a difference of 0.22%).
| Demographics | Rating | Rank | Family Poverty |
| Scandinavians | 99.1 /100 | #42 | Exceptional 7.6% |
| Immigrants | Austria | 99.1 /100 | #43 | Exceptional 7.6% |
| Germans | 99.0 /100 | #44 | Exceptional 7.7% |
| Okinawans | 98.9 /100 | #45 | Exceptional 7.7% |
| Tongans | 98.9 /100 | #46 | Exceptional 7.7% |
| Immigrants | Czechoslovakia | 98.9 /100 | #47 | Exceptional 7.7% |
| Immigrants | Sri Lanka | 98.9 /100 | #48 | Exceptional 7.7% |
| Immigrants | Bolivia | 98.9 /100 | #49 | Exceptional 7.7% |
| Immigrants | North Macedonia | 98.9 /100 | #50 | Exceptional 7.7% |
| Immigrants | Moldova | 98.8 /100 | #51 | Exceptional 7.7% |
| Indians (Asian) | 98.8 /100 | #52 | Exceptional 7.7% |
| Swiss | 98.8 /100 | #53 | Exceptional 7.7% |
| Immigrants | Sweden | 98.8 /100 | #54 | Exceptional 7.7% |
| Immigrants | Eastern Asia | 98.7 /100 | #55 | Exceptional 7.7% |
| Immigrants | Serbia | 98.7 /100 | #56 | Exceptional 7.7% |
Demographics Similar to Venezuelans by Family Poverty
In terms of family poverty, the demographic groups most similar to Venezuelans are South American (9.3%, a difference of 0.12%), Immigrants from Western Asia (9.3%, a difference of 0.13%), Spanish (9.3%, a difference of 0.21%), Immigrants from Venezuela (9.3%, a difference of 0.21%), and Ugandan (9.3%, a difference of 0.22%).
| Demographics | Rating | Rank | Family Poverty |
| Immigrants | Kenya | 34.0 /100 | #188 | Fair 9.2% |
| Immigrants | Afghanistan | 32.1 /100 | #189 | Fair 9.2% |
| Arabs | 31.5 /100 | #190 | Fair 9.2% |
| Ugandans | 28.7 /100 | #191 | Fair 9.3% |
| Spanish | 28.7 /100 | #192 | Fair 9.3% |
| Immigrants | Western Asia | 28.2 /100 | #193 | Fair 9.3% |
| South Americans | 28.1 /100 | #194 | Fair 9.3% |
| Venezuelans | 27.4 /100 | #195 | Fair 9.3% |
| Immigrants | Venezuela | 26.1 /100 | #196 | Fair 9.3% |
| Immigrants | Colombia | 24.4 /100 | #197 | Fair 9.3% |
| Iraqis | 24.2 /100 | #198 | Fair 9.3% |
| Spaniards | 22.8 /100 | #199 | Fair 9.4% |
| Immigrants | Costa Rica | 21.7 /100 | #200 | Fair 9.4% |
| Immigrants | Portugal | 20.5 /100 | #201 | Fair 9.4% |
| Immigrants | Sierra Leone | 19.6 /100 | #202 | Poor 9.4% |